

Өзекті паттерндер

Прямоугольник
сформирован 24.04 в 21:22:37 (UTC+0)
сила сигнала 1 из 5
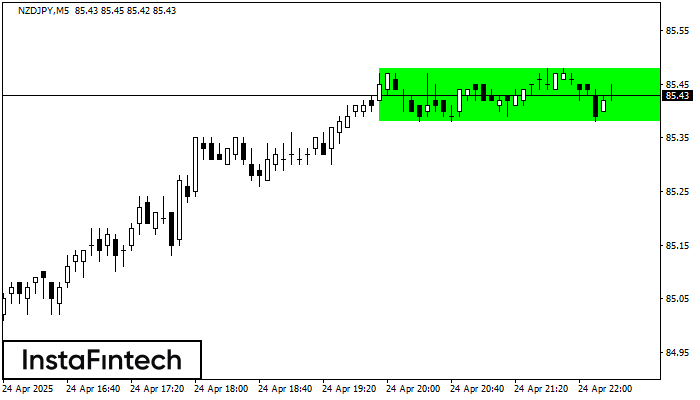
Сформирована фигура «Прямоугольник» на графике NZDJPY M5. Тип фигуры: Продолжение тренда; Границы: Верхняя 85.48, Нижняя 85.38; Сигнал: позицию на покупку следует открывать выше верхней границы прямоугольника 85.48.
Таймфреймы М5 и М15 могут иметь больше ложных точек входа.
- Все
- Все
- Bearish Rectangle
- Bearish Symmetrical Triangle
- Bearish Symmetrical Triangle
- Bullish Rectangle
- Double Top
- Double Top
- Triple Bottom
- Triple Bottom
- Triple Top
- Triple Top
- Все
- Все
- Покупка
- Продажа
- Все
- 1
- 2
- 3
- 4
- 5
Bearish Rectangle
сформирован 14.05 в 08:47:59 (UTC+0)
сила сигнала 2 из 5
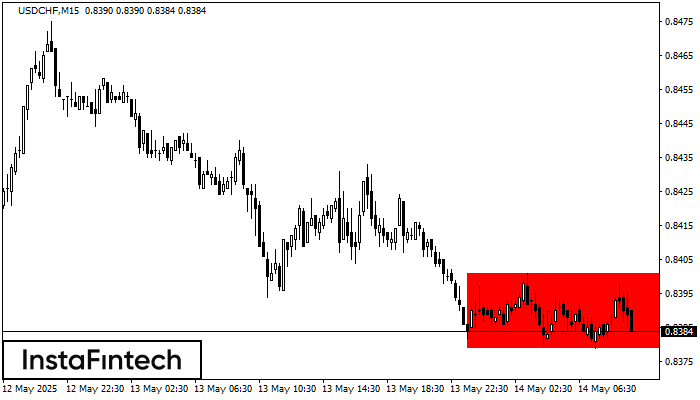
According to the chart of M15, USDCHF formed the Bearish Rectangle. The pattern indicates a trend continuation. The upper border is 0.8401, the lower border is 0.8379. The signal means
The M5 and M15 time frames may have more false entry points.
Открыть график инструмента в новом окне
Head and Shoulders
сформирован 14.05 в 08:30:22 (UTC+0)
сила сигнала 3 из 5
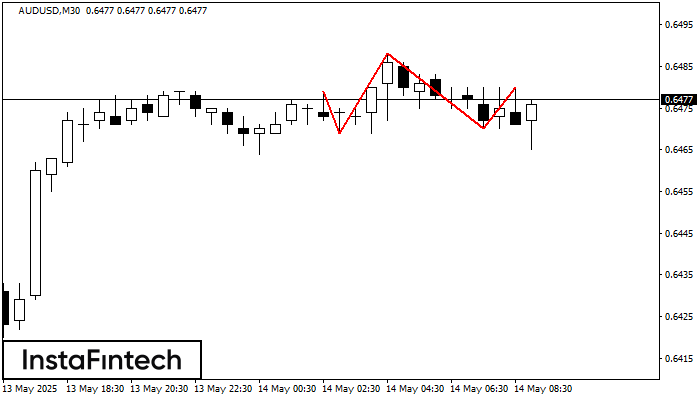
According to the chart of M30, AUDUSD formed the Head and Shoulders pattern. The Head’s top is set at 0.6488 while the median line of the Neck is found
Открыть график инструмента в новом окне
Head and Shoulders
сформирован 14.05 в 08:15:39 (UTC+0)
сила сигнала 2 из 5
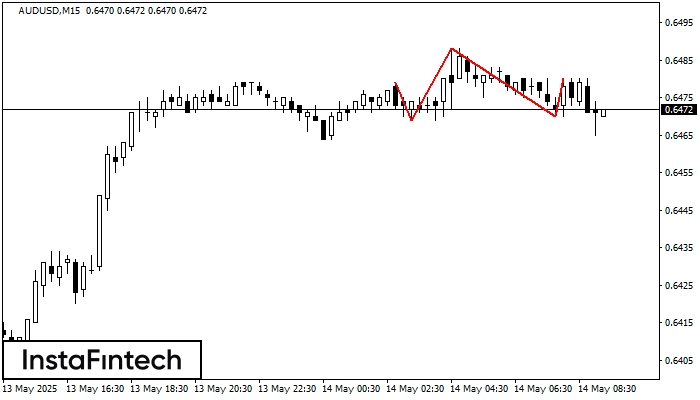
The technical pattern called Head and Shoulders has appeared on the chart of AUDUSD M15. There are weighty reasons to suggest that the price will surpass the Neckline 0.6469/0.6470 after
The M5 and M15 time frames may have more false entry points.
Открыть график инструмента в новом окне


