

Өзекті паттерндер

Двойная вершина
сформирован 24.04 в 17:25:06 (UTC+0)
сила сигнала 1 из 5
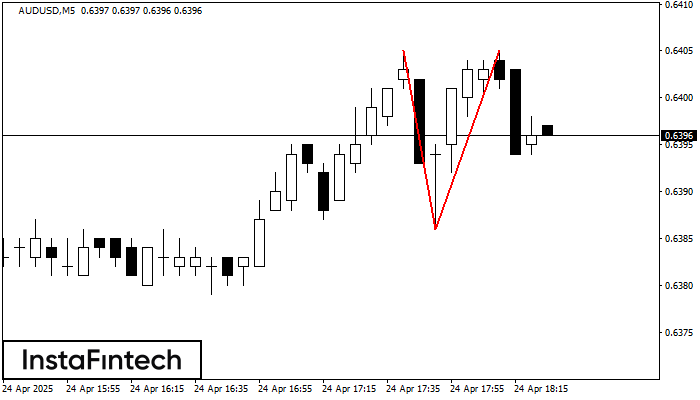
На торговом графике AUDUSD M5 сформировалась разворотная фигура «Двойная вершина». Характеристика: Верхняя граница 0.6405; Нижняя граница 0.6386; Ширина фигуры 19 пунктов. Сигнал: Пробой нижней границы 0.6386 приведет к дальнейшему нисходящему движению с перспективой хода к уровню 0.6371.
Таймфреймы М5 и М15 могут иметь больше ложных точек входа.
- Все
- Все
- Bearish Rectangle
- Bearish Symmetrical Triangle
- Bearish Symmetrical Triangle
- Bullish Rectangle
- Double Top
- Double Top
- Triple Bottom
- Triple Bottom
- Triple Top
- Triple Top
- Все
- Все
- Покупка
- Продажа
- Все
- 1
- 2
- 3
- 4
- 5
Triple Bottom
сформирован 15.05 в 22:30:23 (UTC+0)
сила сигнала 2 из 5
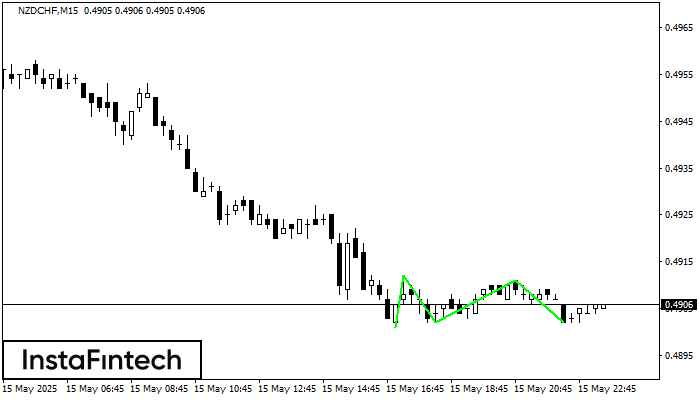
The Triple Bottom pattern has been formed on NZDCHF M15. It has the following characteristics: resistance level 0.4912/0.4911; support level 0.4901/0.4902; the width is 11 points. In the event
The M5 and M15 time frames may have more false entry points.
Открыть график инструмента в новом окне
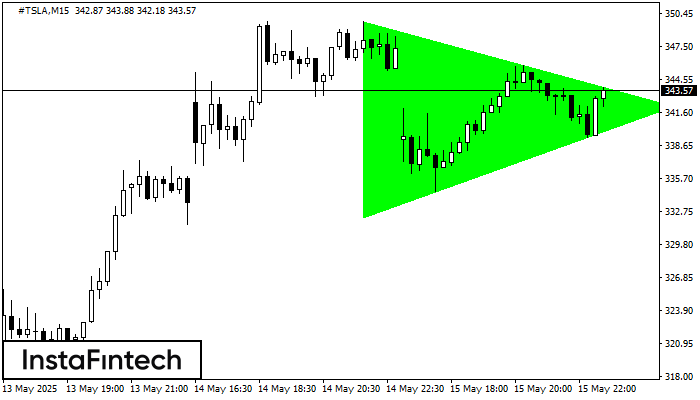
Bullish Symmetrical Triangle
сформирован 15.05 в 21:50:18 (UTC+0)
сила сигнала 2 из 5

According to the chart of M15, #TSLA formed the Bullish Symmetrical Triangle pattern. The lower border of the pattern touches the coordinates 332.24/342.17 whereas the upper border goes across 349.71/342.17
The M5 and M15 time frames may have more false entry points.
Открыть график инструмента в новом окне
Bullish Symmetrical Triangle
сформирован 15.05 в 21:50:15 (UTC+0)
сила сигнала 2 из 5
According to the chart of M15, #TSLA formed the Bullish Symmetrical Triangle pattern. The lower border of the pattern touches the coordinates 332.24/342.17 whereas the upper border goes across 349.71/342.17
The M5 and M15 time frames may have more false entry points.
Открыть график инструмента в новом окне


