

Өзекті паттерндер

Двойная вершина
сформирован 24.04 в 14:00:36 (UTC+0)
сила сигнала 1 из 5
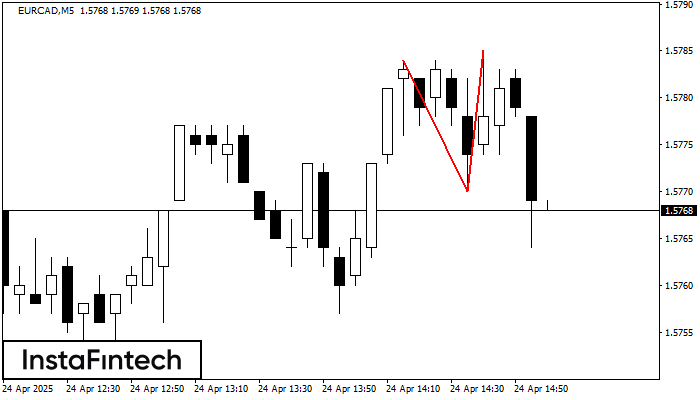
По торговому инструменту EURCAD на M5 сформировалась фигура «Двойная вершина», которая сигнализирует нам об изменении тенденции с восходящей на нисходящую. Вероятно, что, в случае пробоя основания фигуры 1.5770, возможно дальнейшее нисходящее движение.
Таймфреймы М5 и М15 могут иметь больше ложных точек входа.
- Все
- Все
- Bearish Rectangle
- Bearish Symmetrical Triangle
- Bearish Symmetrical Triangle
- Bullish Rectangle
- Double Top
- Double Top
- Triple Bottom
- Triple Bottom
- Triple Top
- Triple Top
- Все
- Все
- Покупка
- Продажа
- Все
- 1
- 2
- 3
- 4
- 5
Bullish Symmetrical Triangle
was formed on 13.05 at 14:24:44 (UTC+0)
signal strength 4 of 5
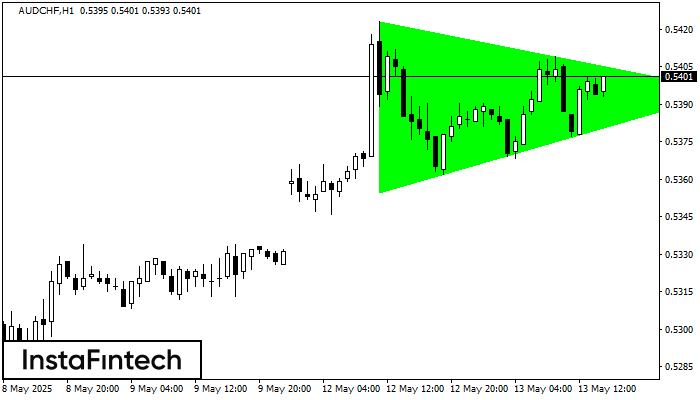
According to the chart of H1, AUDCHF formed the Bullish Symmetrical Triangle pattern, which signals the trend will continue. Description. The upper border of the pattern touches the coordinates 0.5423/0.5395
Open chart in a new window
Bullish Symmetrical Triangle
was formed on 13.05 at 14:24:15 (UTC+0)
signal strength 3 of 5
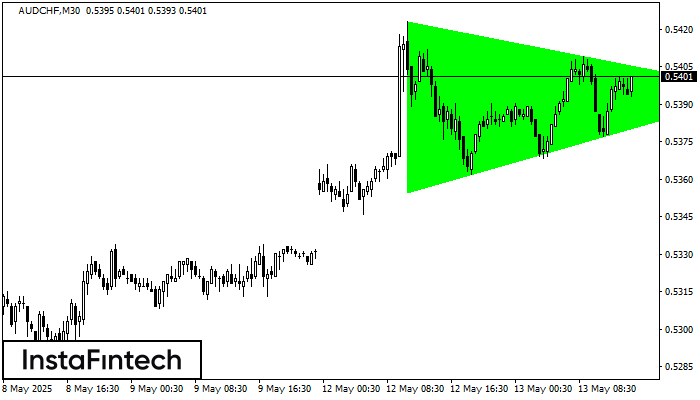
According to the chart of M30, AUDCHF formed the Bullish Symmetrical Triangle pattern, which signals the trend will continue. Description. The upper border of the pattern touches the coordinates 0.5423/0.5395
Open chart in a new window
Bullish Rectangle
was formed on 13.05 at 14:10:32 (UTC+0)
signal strength 1 of 5
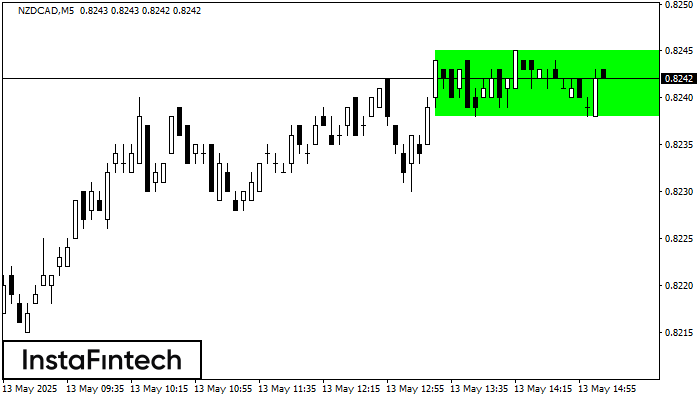
According to the chart of M5, NZDCAD formed the Bullish Rectangle. This type of a pattern indicates a trend continuation. It consists of two levels: resistance 0.8245 and support 0.8238
The M5 and M15 time frames may have more false entry points.
Open chart in a new window


