

Өзекті паттерндер

Двойное дно
сформирован 24.04 в 04:31:17 (UTC+0)
сила сигнала 2 из 5
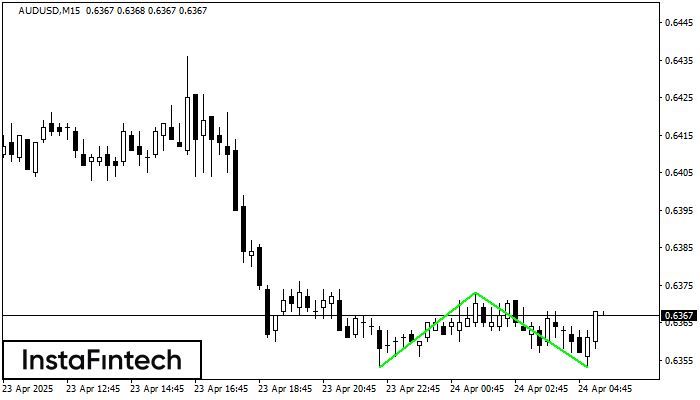
Сформирована фигура «Двойное дно» на графике AUDUSD M15. Верхняя граница 0.6373; Нижняя граница 0.6353; Ширина фигуры 20 пунктов. В случае пробоя верхней границы 0.6373 можно будет прогнозировать изменение тенденции, где ширина фигуры и будет являться расстоянием предположительного Тейк Профита.
Таймфреймы М5 и М15 могут иметь больше ложных точек входа.
- Все
- Все
- Bearish Rectangle
- Bearish Symmetrical Triangle
- Bearish Symmetrical Triangle
- Bullish Rectangle
- Double Top
- Double Top
- Triple Bottom
- Triple Bottom
- Triple Top
- Triple Top
- Все
- Все
- Покупка
- Продажа
- Все
- 1
- 2
- 3
- 4
- 5
Triple Bottom
was formed on 12.05 at 06:35:29 (UTC+0)
signal strength 1 of 5
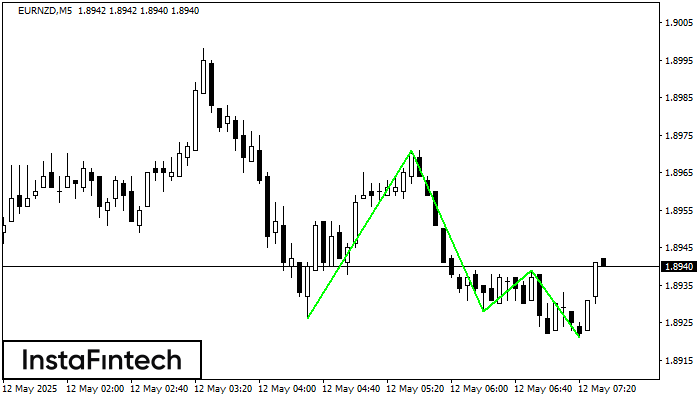
The Triple Bottom pattern has formed on the chart of EURNZD M5. Features of the pattern: The lower line of the pattern has coordinates 1.8971 with the upper limit 1.8971/1.8939
The M5 and M15 time frames may have more false entry points.
Open chart in a new window
Bullish Rectangle
was formed on 12.05 at 06:31:30 (UTC+0)
signal strength 2 of 5
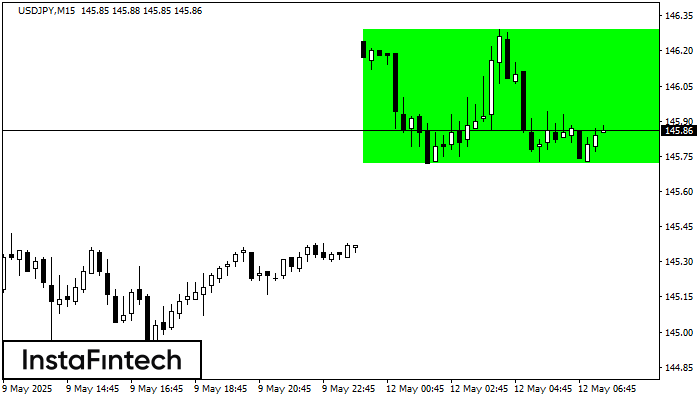
According to the chart of M15, USDJPY formed the Bullish Rectangle. This type of a pattern indicates a trend continuation. It consists of two levels: resistance 146.29 and support 145.72
The M5 and M15 time frames may have more false entry points.
Open chart in a new window
Triple Bottom
was formed on 12.05 at 06:10:15 (UTC+0)
signal strength 1 of 5
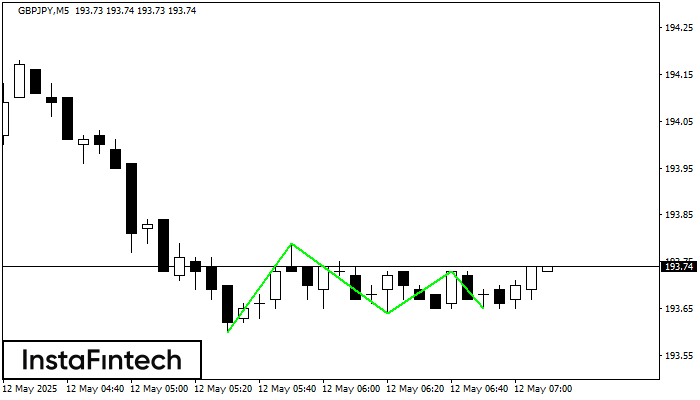
The Triple Bottom pattern has formed on the chart of GBPJPY M5. Features of the pattern: The lower line of the pattern has coordinates 193.79 with the upper limit 193.79/193.73
The M5 and M15 time frames may have more false entry points.
Open chart in a new window


