

Өзекті паттерндер

Двойное дно
сформирован 23.04 в 15:30:42 (UTC+0)
сила сигнала 5 из 5

Сформирована фигура «Двойное дно» на графике #FB D1. Характеристика: Уровень поддержки 482.05; Уровень сопротивления 587.72; Ширина фигуры 10567 пунктов. В случае пробоя уровня сопротивления можно будет прогнозировать изменение тенденции, где первая точка фиксации прибыли находится на расстоянии 10777 пунктов.
- Все
- Все
- Bearish Rectangle
- Bearish Symmetrical Triangle
- Bearish Symmetrical Triangle
- Bullish Rectangle
- Double Top
- Double Top
- Triple Bottom
- Triple Bottom
- Triple Top
- Triple Top
- Все
- Все
- Покупка
- Продажа
- Все
- 1
- 2
- 3
- 4
- 5
Bearish Rectangle
сформирован 15.05 в 06:55:13 (UTC+0)
сила сигнала 1 из 5

According to the chart of M5, GBPJPY formed the Bearish Rectangle. This type of a pattern indicates a trend continuation. It consists of two levels: resistance 194.04 - 0.00
The M5 and M15 time frames may have more false entry points.
Открыть график инструмента в новом окне
Bearish Rectangle
сформирован 15.05 в 06:36:51 (UTC+0)
сила сигнала 1 из 5
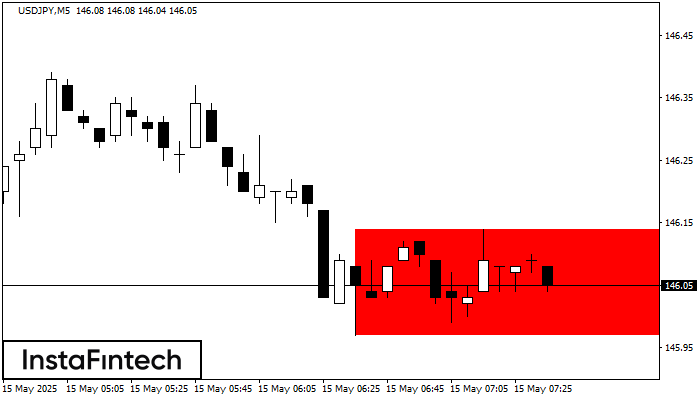
According to the chart of M5, USDJPY formed the Bearish Rectangle. The pattern indicates a trend continuation. The upper border is 146.14, the lower border is 145.97. The signal means
The M5 and M15 time frames may have more false entry points.
Открыть график инструмента в новом окне
Bearish pennant
сформирован 15.05 в 06:03:56 (UTC+0)
сила сигнала 2 из 5

The Bearish pennant pattern has formed on the USDJPY M15 chart. This pattern type is characterized by a slight slowdown after which the price will move in the direction
The M5 and M15 time frames may have more false entry points.
Открыть график инструмента в новом окне


