

Өзекті паттерндер

Двойное дно
сформирован 23.04 в 12:00:11 (UTC+0)
сила сигнала 2 из 5

Сформирована фигура «Двойное дно» на графике USDJPY M15. Верхняя граница 141.96; Нижняя граница 141.59; Ширина фигуры 41 пунктов. В случае пробоя верхней границы 141.96 можно будет прогнозировать изменение тенденции, где ширина фигуры и будет являться расстоянием предположительного Тейк Профита.
Таймфреймы М5 и М15 могут иметь больше ложных точек входа.
- Все
- Все
- Bearish Rectangle
- Bearish Symmetrical Triangle
- Bearish Symmetrical Triangle
- Bullish Rectangle
- Double Top
- Double Top
- Triple Bottom
- Triple Bottom
- Triple Top
- Triple Top
- Все
- Все
- Покупка
- Продажа
- Все
- 1
- 2
- 3
- 4
- 5
Bearish Rectangle
was formed on 13.05 at 18:18:44 (UTC+0)
signal strength 1 of 5
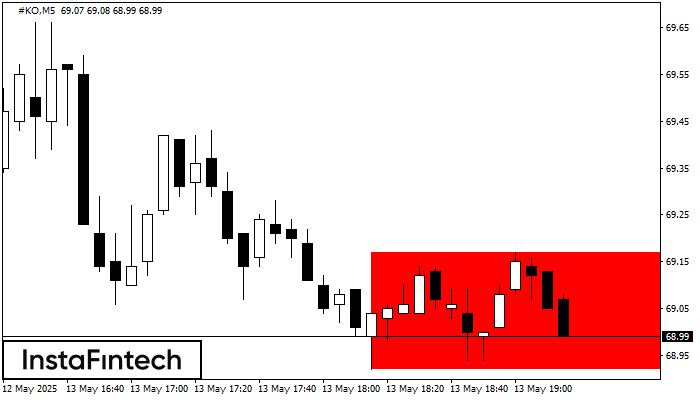
According to the chart of M5, #KO formed the Bearish Rectangle which is a pattern of a trend continuation. The pattern is contained within the following borders: lower border 68.92
The M5 and M15 time frames may have more false entry points.
Open chart in a new window
Double Bottom
was formed on 13.05 at 18:05:05 (UTC+0)
signal strength 1 of 5
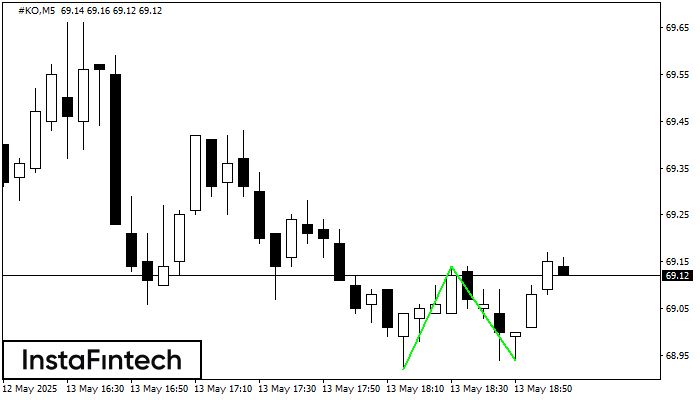
The Double Bottom pattern has been formed on #KO M5; the upper boundary is 69.14; the lower boundary is 68.94. The width of the pattern is 22 points. In case
The M5 and M15 time frames may have more false entry points.
Open chart in a new window
Double Top
was formed on 13.05 at 17:49:45 (UTC+0)
signal strength 1 of 5
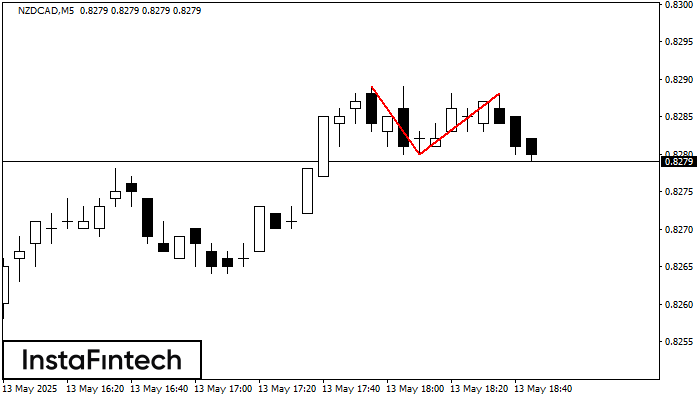
On the chart of NZDCAD M5 the Double Top reversal pattern has been formed. Characteristics: the upper boundary 0.8288; the lower boundary 0.8280; the width of the pattern 8 points
The M5 and M15 time frames may have more false entry points.
Open chart in a new window


