

Өзекті паттерндер

Прямоугольник
сформирован 16.04 в 05:35:30 (UTC+0)
сила сигнала 1 из 5
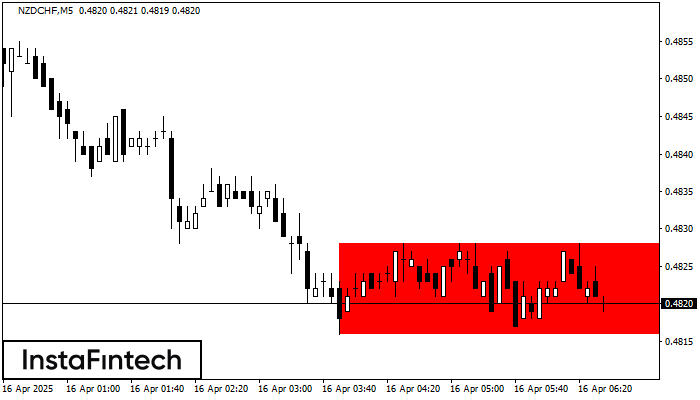
По NZDCHF M5 сформировалась фигура - «Прямоугольник». Фигура данного типа относится к тому типу продолжения тренда, который имеет два уровня: Сопротивление 0.4828; Поддержка 0.4816. В случае пробоя уровня поддержки 0.4816 возможно дальнейшее нисходящее движение.
Таймфреймы М5 и М15 могут иметь больше ложных точек входа.
Сондай-ақ қараңыз
- Все
- Все
- Bearish Rectangle
- Bearish Symmetrical Triangle
- Bearish Symmetrical Triangle
- Bullish Rectangle
- Double Top
- Double Top
- Triple Bottom
- Triple Bottom
- Triple Top
- Triple Top
- Все
- Все
- Покупка
- Продажа
- Все
- 1
- 2
- 3
- 4
- 5
Double Bottom
was formed on 21.05 at 06:56:25 (UTC+0)
signal strength 1 of 5
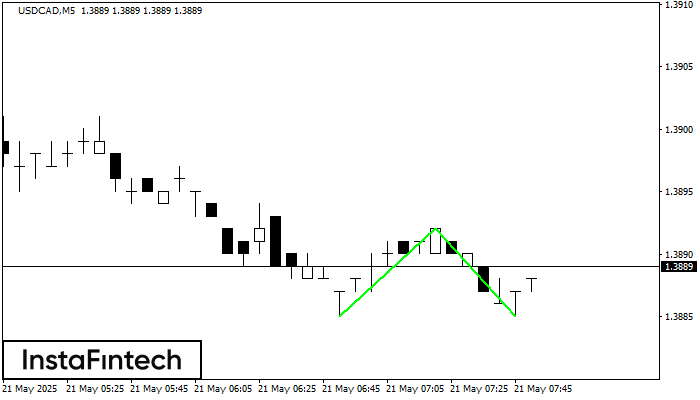
The Double Bottom pattern has been formed on USDCAD M5; the upper boundary is 1.3892; the lower boundary is 1.3885. The width of the pattern is 7 points. In case
The M5 and M15 time frames may have more false entry points.
Open chart in a new window
Double Bottom
was formed on 21.05 at 06:45:15 (UTC+0)
signal strength 2 of 5
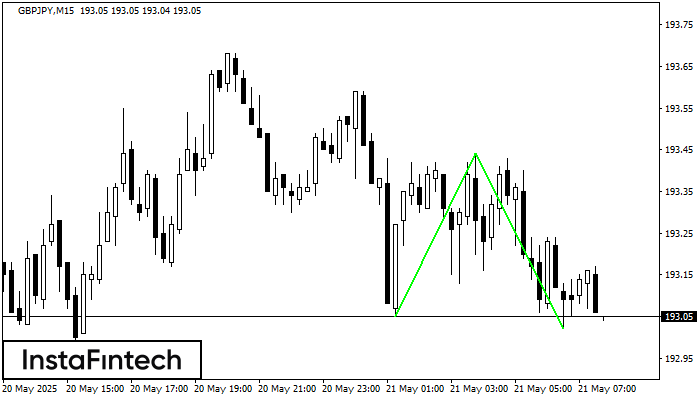
The Double Bottom pattern has been formed on GBPJPY M15; the upper boundary is 193.44; the lower boundary is 193.02. The width of the pattern is 39 points. In case
The M5 and M15 time frames may have more false entry points.
Open chart in a new window
Bearish Symmetrical Triangle
was formed on 21.05 at 06:17:36 (UTC+0)
signal strength 3 of 5
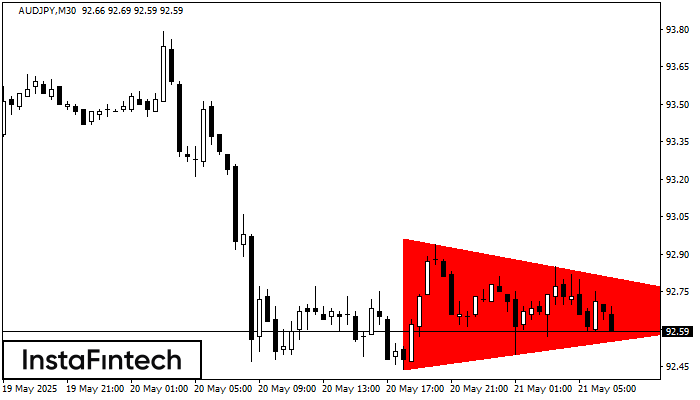
According to the chart of M30, AUDJPY formed the Bearish Symmetrical Triangle pattern. Description: The lower border is 92.44/92.66 and upper border is 92.96/92.66. The pattern width is measured
Open chart in a new window


