

Өзекті паттерндер

Бычий вымпел
сформирован 14.04 в 16:00:24 (UTC+0)
сила сигнала 1 из 5
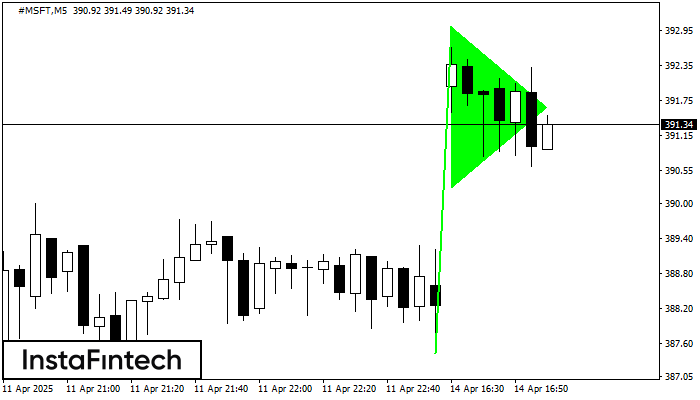
На графике #MSFT M5 сформировался паттерн «Бычий вымпел», который относится к фигуре продолжения тренда. Можно предполагать, что, в случае фиксации цены выше максимума вымпела 393.01, возможно дальнейшее восходящее движение.
Таймфреймы М5 и М15 могут иметь больше ложных точек входа.
- Все
- Все
- Bearish Rectangle
- Bearish Symmetrical Triangle
- Bearish Symmetrical Triangle
- Bullish Rectangle
- Double Top
- Double Top
- Triple Bottom
- Triple Bottom
- Triple Top
- Triple Top
- Все
- Все
- Покупка
- Продажа
- Все
- 1
- 2
- 3
- 4
- 5
Bearish Flag
сформирован 28.05 в 14:20:24 (UTC+0)
сила сигнала 1 из 5
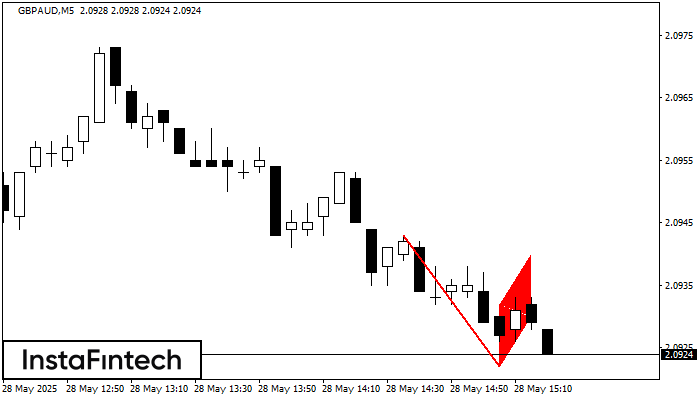
The Bearish Flag pattern has been formed on the chart GBPAUD M5. Therefore, the downwards trend is likely to continue in the nearest term. As soon as the price breaks
The M5 and M15 time frames may have more false entry points.
Открыть график инструмента в новом окне
Bearish pennant
сформирован 28.05 в 14:20:19 (UTC+0)
сила сигнала 1 из 5
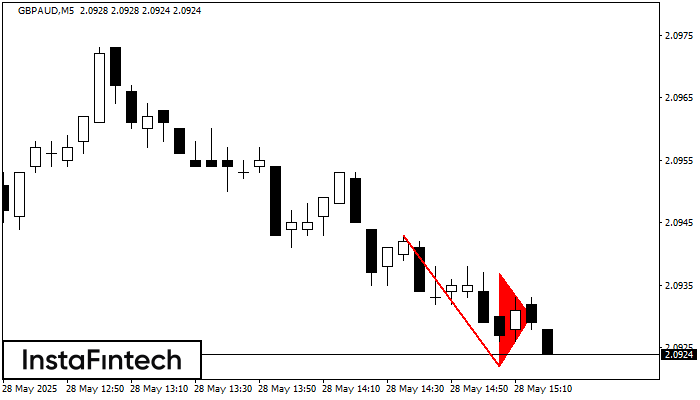
The Bearish pennant pattern has formed on the GBPAUD M5 chart. It signals potential continuation of the existing trend. Specifications: the pattern’s bottom has the coordinate of 2.0922; the projection
The M5 and M15 time frames may have more false entry points.
Открыть график инструмента в новом окне
Double Top
сформирован 28.05 в 13:30:54 (UTC+0)
сила сигнала 3 из 5
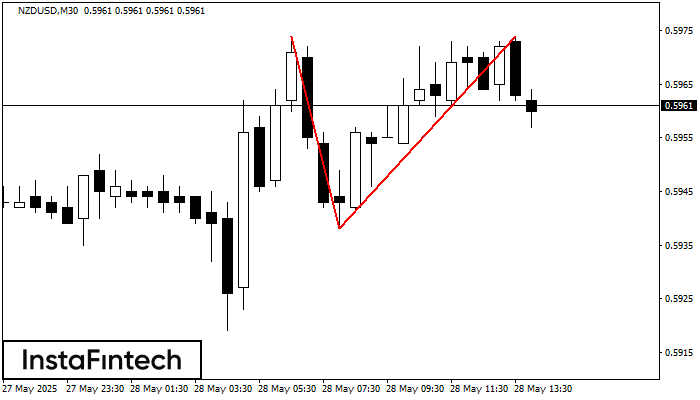
The Double Top pattern has been formed on NZDUSD M30. It signals that the trend has been changed from upwards to downwards. Probably, if the base of the pattern 0.5938
Открыть график инструмента в новом окне


