

Өзекті паттерндер

Тройное дно
сформирован 07.04 в 19:00:23 (UTC+0)
сила сигнала 1 из 5

Сформирована фигура «Тройное дно» по торговому инструменту #EBAY на M5. Фигура сигнализирует об изменении тенденции с нисходящей на восходящую в случае пробоя верхней границы 61.26.
Таймфреймы М5 и М15 могут иметь больше ложных точек входа.
- Все
- Все
- Bearish Rectangle
- Bearish Symmetrical Triangle
- Bearish Symmetrical Triangle
- Bullish Rectangle
- Double Top
- Double Top
- Triple Bottom
- Triple Bottom
- Triple Top
- Triple Top
- Все
- Все
- Покупка
- Продажа
- Все
- 1
- 2
- 3
- 4
- 5
Double Top
was formed on 15.05 at 13:30:05 (UTC+0)
signal strength 1 of 5
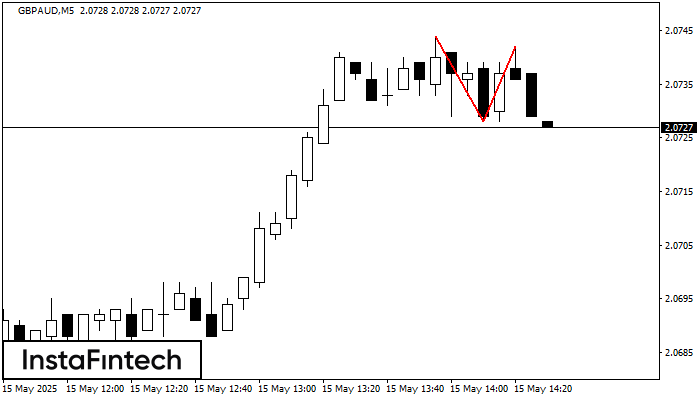
The Double Top pattern has been formed on GBPAUD M5. It signals that the trend has been changed from upwards to downwards. Probably, if the base of the pattern 2.0728
The M5 and M15 time frames may have more false entry points.
Open chart in a new window
Double Bottom
was formed on 15.05 at 11:55:04 (UTC+0)
signal strength 1 of 5
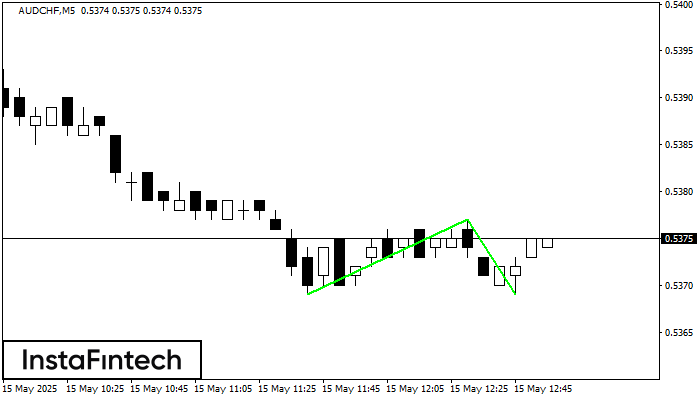
The Double Bottom pattern has been formed on AUDCHF M5; the upper boundary is 0.5377; the lower boundary is 0.5369. The width of the pattern is 8 points. In case
The M5 and M15 time frames may have more false entry points.
Open chart in a new window
Bearish Rectangle
was formed on 15.05 at 11:39:52 (UTC+0)
signal strength 3 of 5
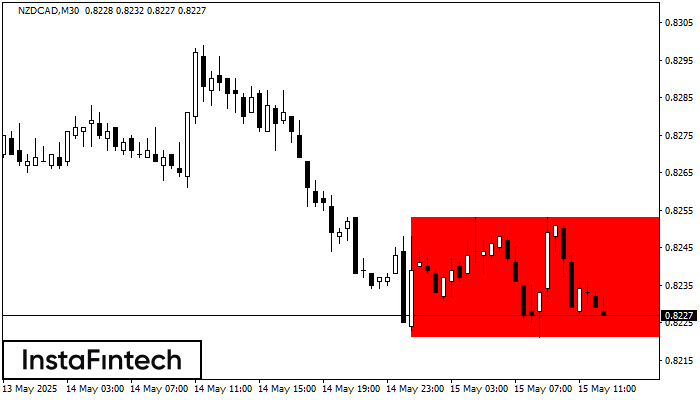
According to the chart of M30, NZDCAD formed the Bearish Rectangle. The pattern indicates a trend continuation. The upper border is 0.8253, the lower border is 0.8221. The signal means
Open chart in a new window


