

Өзекті паттерндер

Голова и плечи
сформирован 07.04 в 15:29:59 (UTC+0)
сила сигнала 1 из 5

На графике USDCAD M5 сформировалась фигура «Голова и плечи» с характеристикой: Вершина головы 1.4295; Уровень шеи, восходящий угол - 1.4237/1.4245. Формирование данной фигуры может привести к изменению текущей тенденции с восходящей на нисходящую. Вероятно предполагать, что курс USDCAD, в случае срабатывания фигуры, пойдет в направлении 1.4230 (10 - 20 пунктов).
Таймфреймы М5 и М15 могут иметь больше ложных точек входа.
- Все
- Все
- Bearish Rectangle
- Bearish Symmetrical Triangle
- Bearish Symmetrical Triangle
- Bullish Rectangle
- Double Top
- Double Top
- Triple Bottom
- Triple Bottom
- Triple Top
- Triple Top
- Все
- Все
- Покупка
- Продажа
- Все
- 1
- 2
- 3
- 4
- 5
Triple Bottom
сформирован 21.05 в 22:20:30 (UTC+0)
сила сигнала 1 из 5
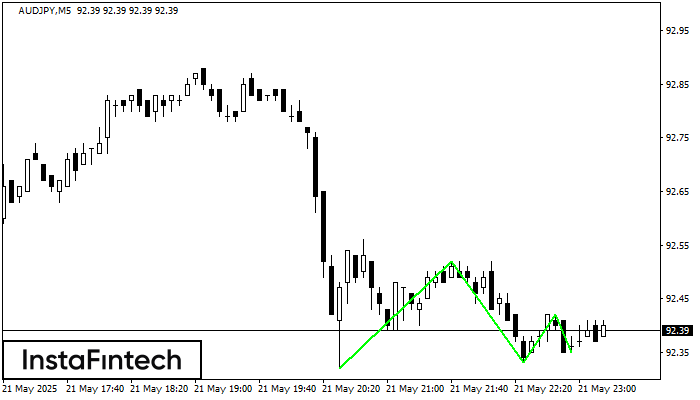
The Triple Bottom pattern has formed on the chart of AUDJPY M5. Features of the pattern: The lower line of the pattern has coordinates 92.52 with the upper limit 92.52/92.42
The M5 and M15 time frames may have more false entry points.
Открыть график инструмента в новом окне
Double Bottom
сформирован 21.05 в 21:50:29 (UTC+0)
сила сигнала 1 из 5
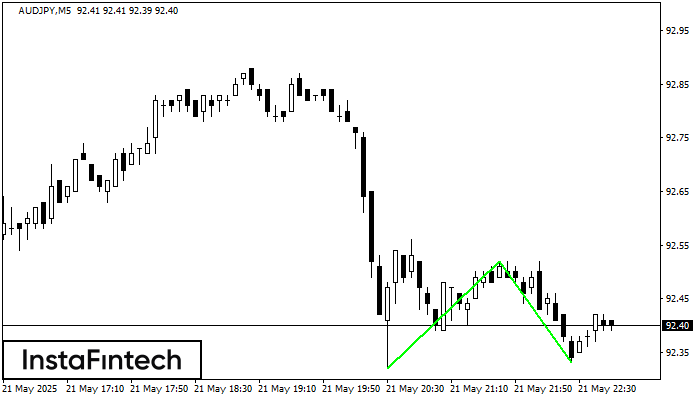
The Double Bottom pattern has been formed on AUDJPY M5; the upper boundary is 92.52; the lower boundary is 92.33. The width of the pattern is 20 points. In case
The M5 and M15 time frames may have more false entry points.
Открыть график инструмента в новом окне
Bearish pennant
сформирован 21.05 в 21:50:09 (UTC+0)
сила сигнала 1 из 5
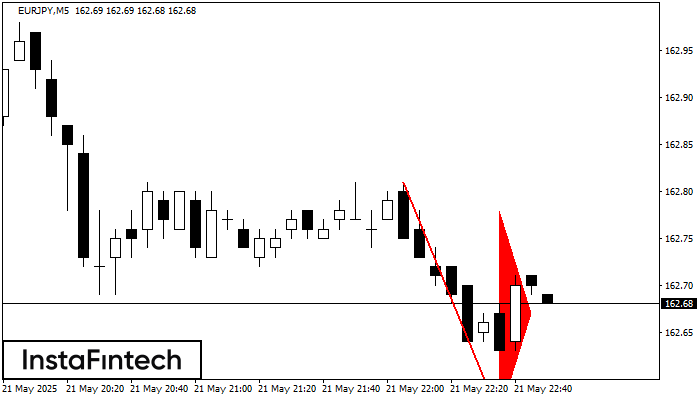
The Bearish pennant pattern has formed on the EURJPY M5 chart. This pattern type is characterized by a slight slowdown after which the price will move in the direction
The M5 and M15 time frames may have more false entry points.
Открыть график инструмента в новом окне


