

Өзекті паттерндер

Медвежий симметричный треугольник
сформирован 07.04 в 02:45:25 (UTC+0)
сила сигнала 1 из 5
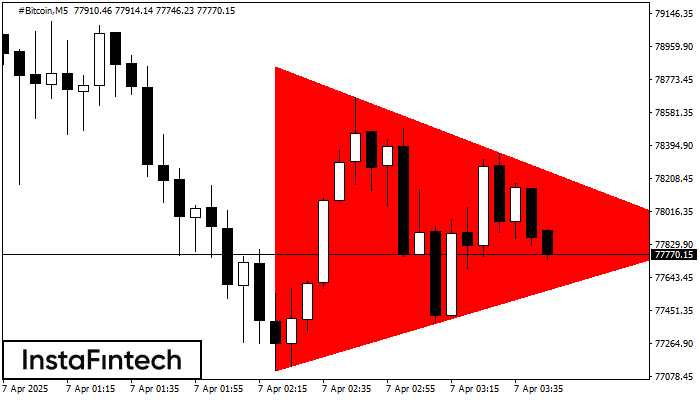
На графике #Bitcoin на M5 сформировалась фигура «Медвежий симметричный треугольник». Торговые рекомендации: Пробой нижней границы 77111.27 с большой долей вероятности приведет к продолжению нисходящего тренда.
Таймфреймы М5 и М15 могут иметь больше ложных точек входа.
- Все
- Все
- Bearish Rectangle
- Bearish Symmetrical Triangle
- Bearish Symmetrical Triangle
- Bullish Rectangle
- Double Top
- Double Top
- Triple Bottom
- Triple Bottom
- Triple Top
- Triple Top
- Все
- Все
- Покупка
- Продажа
- Все
- 1
- 2
- 3
- 4
- 5
Bullish Symmetrical Triangle
сформирован 12.05 в 18:18:48 (UTC+0)
сила сигнала 1 из 5
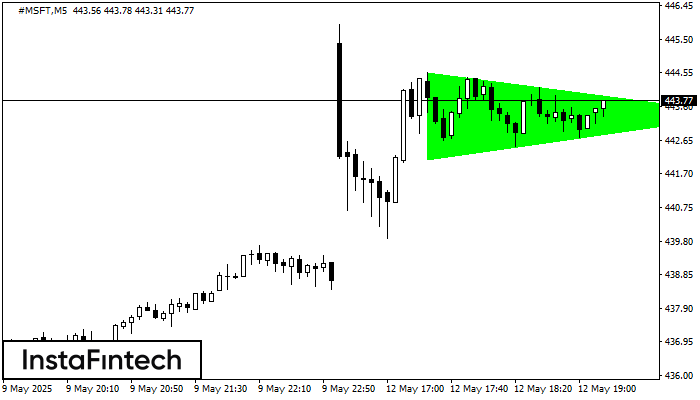
According to the chart of M5, #MSFT formed the Bullish Symmetrical Triangle pattern, which signals the trend will continue. Description. The upper border of the pattern touches the coordinates 444.56/443.38
The M5 and M15 time frames may have more false entry points.
Открыть график инструмента в новом окне
Double Bottom
сформирован 12.05 в 18:05:22 (UTC+0)
сила сигнала 1 из 5
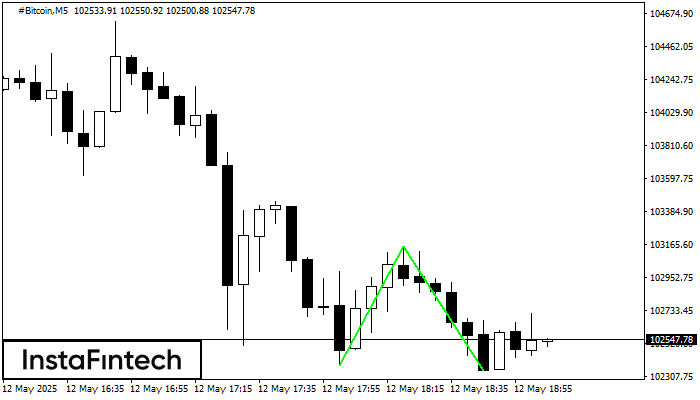
The Double Bottom pattern has been formed on #Bitcoin M5. This formation signals a reversal of the trend from downwards to upwards. The signal is that a buy trade should
The M5 and M15 time frames may have more false entry points.
Открыть график инструмента в новом окне
Triple Top
сформирован 12.05 в 17:55:24 (UTC+0)
сила сигнала 1 из 5
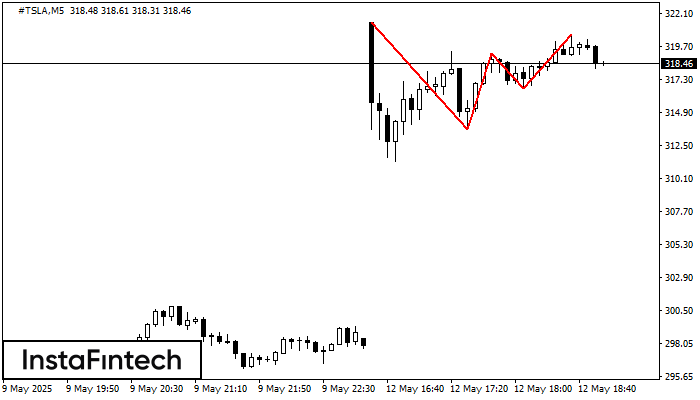
The Triple Top pattern has formed on the chart of the #TSLA M5 trading instrument. It is a reversal pattern featuring the following characteristics: resistance level 86, support level -304
The M5 and M15 time frames may have more false entry points.
Открыть график инструмента в новом окне


