

Өзекті паттерндер

Прямоугольник
сформирован 06.04 в 23:00:32 (UTC+0)
сила сигнала 3 из 5
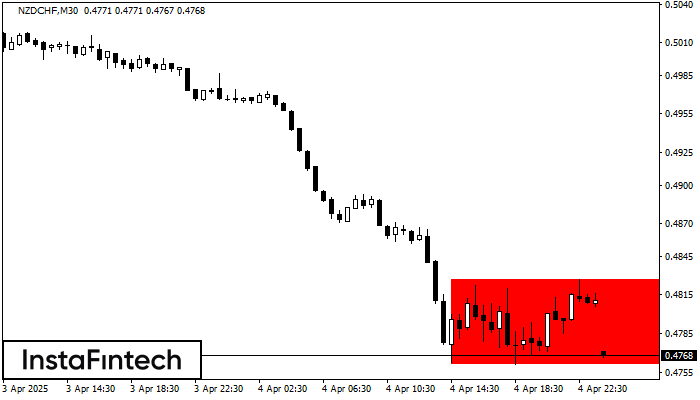
Сформирована фигура «Прямоугольник» на графике NZDCHF M30. Тип фигуры: Продолжение тренда; Границы: Верхняя 0.4827, Нижняя 0.4761; Сигнал: позиция на продажу открывается после фиксации цены ниже границы прямоугольника 0.4761.
- Все
- Все
- Bearish Rectangle
- Bearish Symmetrical Triangle
- Bearish Symmetrical Triangle
- Bullish Rectangle
- Double Top
- Double Top
- Triple Bottom
- Triple Bottom
- Triple Top
- Triple Top
- Все
- Все
- Покупка
- Продажа
- Все
- 1
- 2
- 3
- 4
- 5
Bearish Rectangle
сформирован 28.05 в 17:36:39 (UTC+0)
сила сигнала 1 из 5
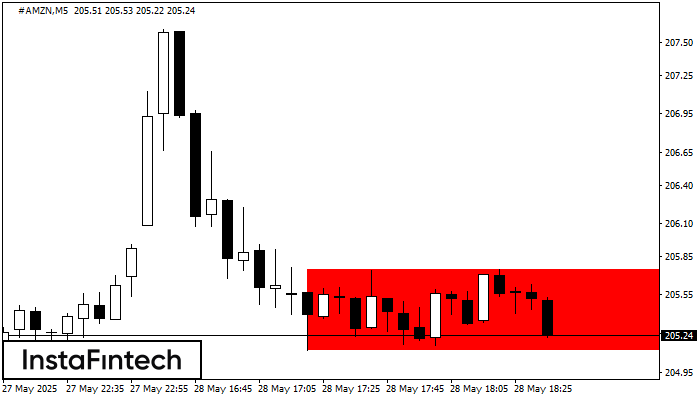
According to the chart of M5, #AMZN formed the Bearish Rectangle. This type of a pattern indicates a trend continuation. It consists of two levels: resistance 205.75 - 0.00
The M5 and M15 time frames may have more false entry points.
Открыть график инструмента в новом окне
Bullish Symmetrical Triangle
сформирован 28.05 в 17:35:33 (UTC+0)
сила сигнала 1 из 5
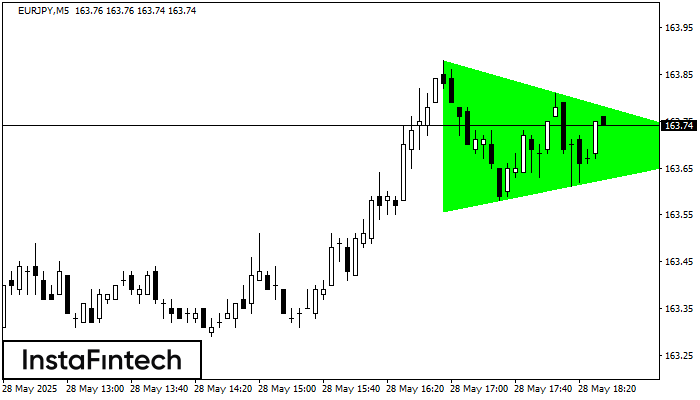
According to the chart of M5, EURJPY formed the Bullish Symmetrical Triangle pattern. Description: This is the pattern of a trend continuation. 163.88 and 163.56 are the coordinates
The M5 and M15 time frames may have more false entry points.
Открыть график инструмента в новом окне
Double Bottom
сформирован 28.05 в 17:35:28 (UTC+0)
сила сигнала 1 из 5
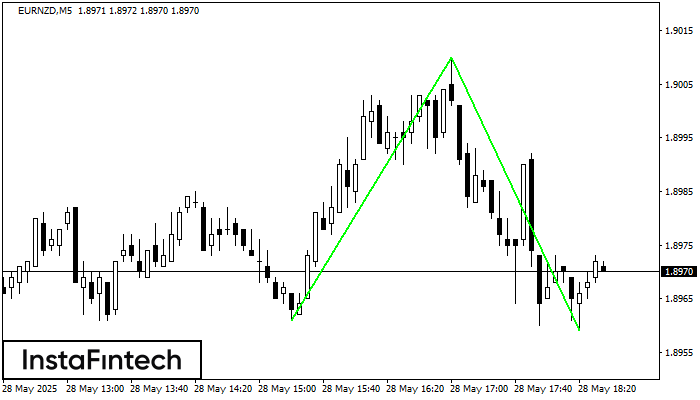
The Double Bottom pattern has been formed on EURNZD M5; the upper boundary is 1.9010; the lower boundary is 1.8959. The width of the pattern is 49 points. In case
The M5 and M15 time frames may have more false entry points.
Открыть график инструмента в новом окне


