

Өзекті паттерндер

Двойное дно
сформирован 04.04 в 03:00:34 (UTC+0)
сила сигнала 4 из 5
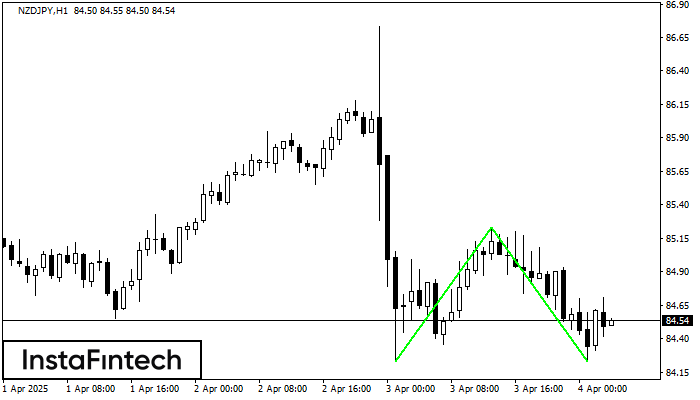
Сформирована фигура «Двойное дно» на графике NZDJPY H1. Верхняя граница 85.23; Нижняя граница 84.23; Ширина фигуры 100 пунктов. В случае пробоя верхней границы 85.23 можно будет прогнозировать изменение тенденции, где ширина фигуры и будет являться расстоянием предположительного Тейк Профита.
- Все
- Все
- Bearish Rectangle
- Bearish Symmetrical Triangle
- Bearish Symmetrical Triangle
- Bullish Rectangle
- Double Top
- Double Top
- Triple Bottom
- Triple Bottom
- Triple Top
- Triple Top
- Все
- Все
- Покупка
- Продажа
- Все
- 1
- 2
- 3
- 4
- 5
Bearish Rectangle
сформирован 23.05 в 23:00:20 (UTC+0)
сила сигнала 1 из 5

According to the chart of M5, EURNZD formed the Bearish Rectangle. The pattern indicates a trend continuation. The upper border is 1.8982, the lower border is 1.8964. The signal means
The M5 and M15 time frames may have more false entry points.
Открыть график инструмента в новом окне
Bullish Symmetrical Triangle
сформирован 23.05 в 22:14:53 (UTC+0)
сила сигнала 1 из 5

According to the chart of M5, AUDCHF formed the Bullish Symmetrical Triangle pattern. Description: This is the pattern of a trend continuation. 0.5335 and 0.5329 are the coordinates
The M5 and M15 time frames may have more false entry points.
Открыть график инструмента в новом окне
Bullish Symmetrical Triangle
сформирован 23.05 в 22:10:58 (UTC+0)
сила сигнала 1 из 5

According to the chart of M5, AUDJPY formed the Bullish Symmetrical Triangle pattern. Description: This is the pattern of a trend continuation. 92.60 and 92.44 are the coordinates
The M5 and M15 time frames may have more false entry points.
Открыть график инструмента в новом окне


