

Өзекті паттерндер

Двойное дно
сформирован 03.04 в 19:30:16 (UTC+0)
сила сигнала 1 из 5
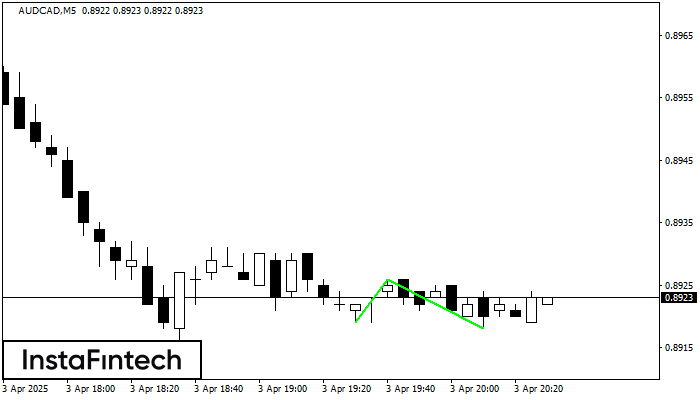
Сформирована фигура «Двойное дно» на графике AUDCAD M5. Верхняя граница 0.8926; Нижняя граница 0.8918; Ширина фигуры 7 пунктов. В случае пробоя верхней границы 0.8926 можно будет прогнозировать изменение тенденции, где ширина фигуры и будет являться расстоянием предположительного Тейк Профита.
Таймфреймы М5 и М15 могут иметь больше ложных точек входа.
- Все
- Все
- Bearish Rectangle
- Bearish Symmetrical Triangle
- Bearish Symmetrical Triangle
- Bullish Rectangle
- Double Top
- Double Top
- Triple Bottom
- Triple Bottom
- Triple Top
- Triple Top
- Все
- Все
- Покупка
- Продажа
- Все
- 1
- 2
- 3
- 4
- 5
Triple Bottom
сформирован 22.05 в 07:26:02 (UTC+0)
сила сигнала 1 из 5
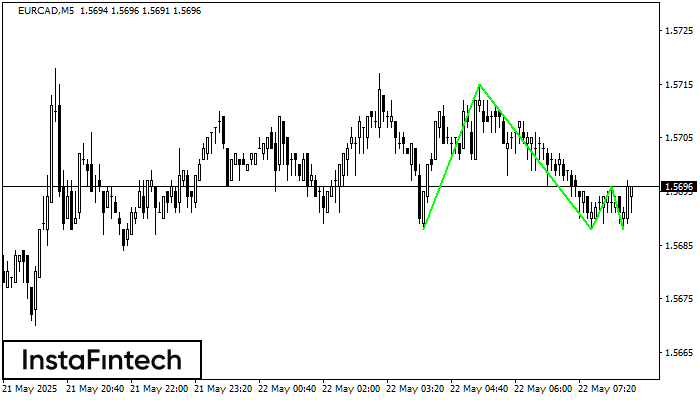
The Triple Bottom pattern has formed on the chart of EURCAD M5. Features of the pattern: The lower line of the pattern has coordinates 1.5715 with the upper limit 1.5715/1.5696
The M5 and M15 time frames may have more false entry points.
Открыть график инструмента в новом окне
Double Bottom
сформирован 22.05 в 07:00:31 (UTC+0)
сила сигнала 4 из 5
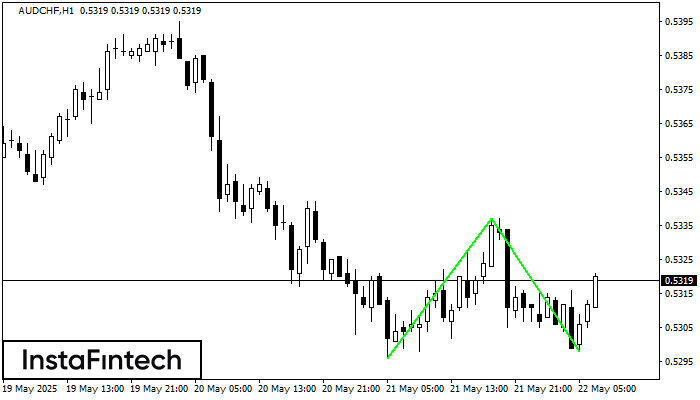
The Double Bottom pattern has been formed on AUDCHF H1. This formation signals a reversal of the trend from downwards to upwards. The signal is that a buy trade should
Открыть график инструмента в новом окне
Double Bottom
сформирован 22.05 в 06:15:30 (UTC+0)
сила сигнала 2 из 5
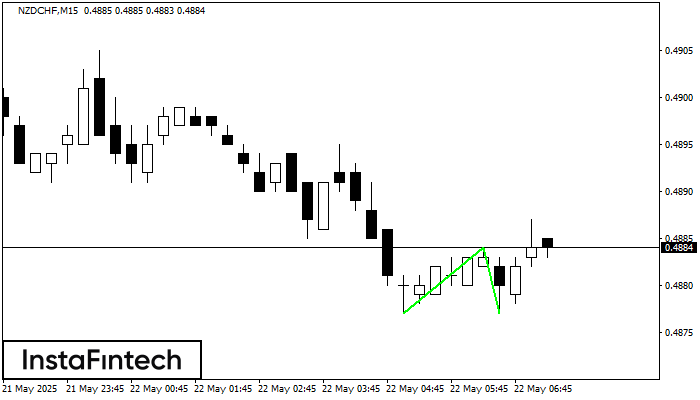
The Double Bottom pattern has been formed on NZDCHF M15. This formation signals a reversal of the trend from downwards to upwards. The signal is that a buy trade should
The M5 and M15 time frames may have more false entry points.
Открыть график инструмента в новом окне


