

Өзекті паттерндер

Двойная вершина
сформирован 03.04 в 09:29:55 (UTC+0)
сила сигнала 3 из 5
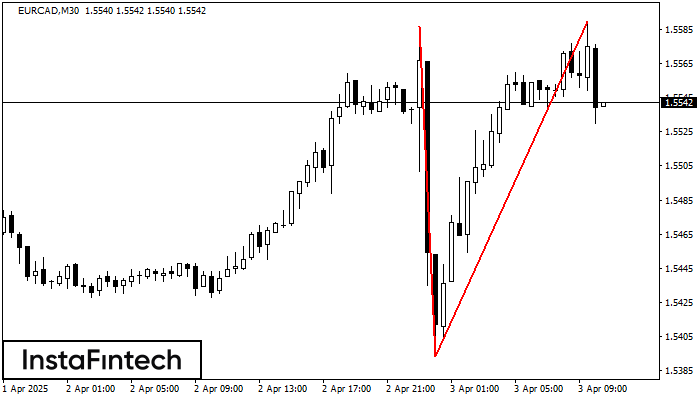
На торговом графике EURCAD M30 сформировалась разворотная фигура «Двойная вершина». Характеристика: Верхняя граница 1.5590; Нижняя граница 1.5393; Ширина фигуры 197 пунктов. Сигнал: Пробой нижней границы 1.5393 приведет к дальнейшему нисходящему движению с перспективой хода к уровню 1.5363.
- Все
- Все
- Bearish Rectangle
- Bearish Symmetrical Triangle
- Bearish Symmetrical Triangle
- Bullish Rectangle
- Double Top
- Double Top
- Triple Bottom
- Triple Bottom
- Triple Top
- Triple Top
- Все
- Все
- Покупка
- Продажа
- Все
- 1
- 2
- 3
- 4
- 5
Bullish Rectangle
сформирован 21.05 в 00:46:25 (UTC+0)
сила сигнала 1 из 5
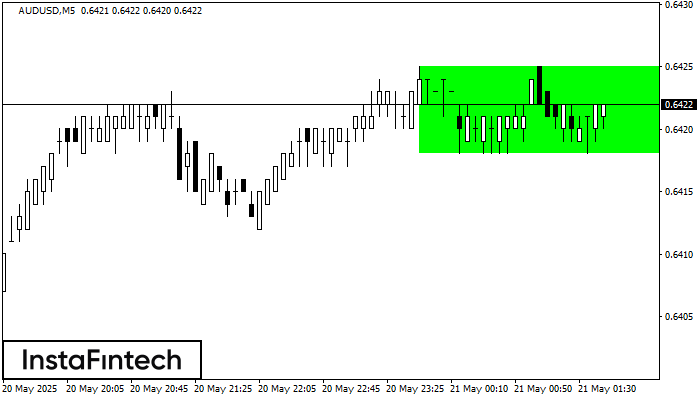
According to the chart of M5, AUDUSD formed the Bullish Rectangle which is a pattern of a trend continuation. The pattern is contained within the following borders: the lower border
The M5 and M15 time frames may have more false entry points.
Открыть график инструмента в новом окне
Triple Top
сформирован 21.05 в 00:15:24 (UTC+0)
сила сигнала 2 из 5
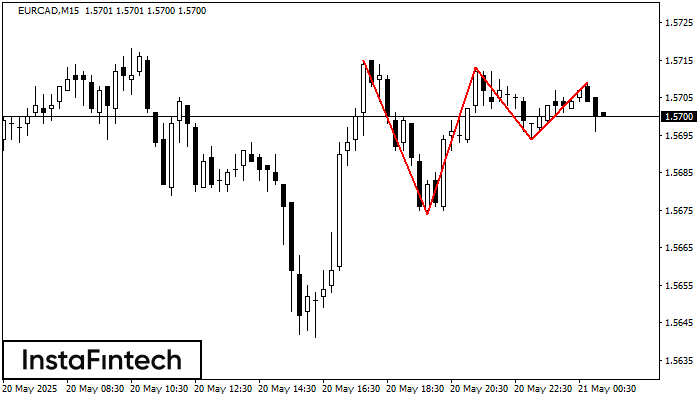
On the chart of the EURCAD M15 trading instrument, the Triple Top pattern that signals a trend change has formed. It is possible that after formation of the third peak
The M5 and M15 time frames may have more false entry points.
Открыть график инструмента в новом окне
Bearish Rectangle
сформирован 20.05 в 23:35:46 (UTC+0)
сила сигнала 1 из 5
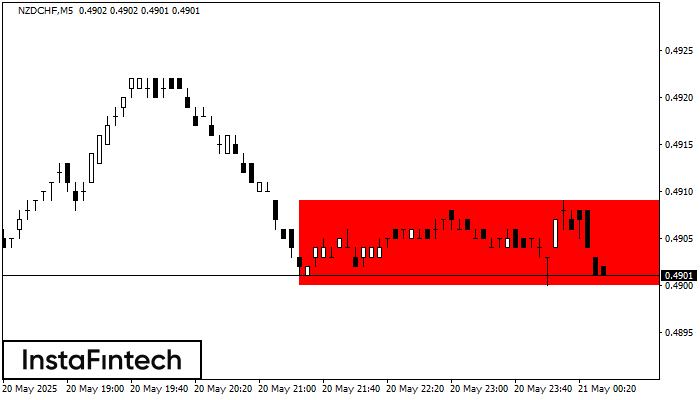
According to the chart of M5, NZDCHF formed the Bearish Rectangle. The pattern indicates a trend continuation. The upper border is 0.4909, the lower border is 0.4900. The signal means
The M5 and M15 time frames may have more false entry points.
Открыть график инструмента в новом окне


