

Өзекті паттерндер

Медвежий вымпел
сформирован 02.04 в 14:55:25 (UTC+0)
сила сигнала 1 из 5
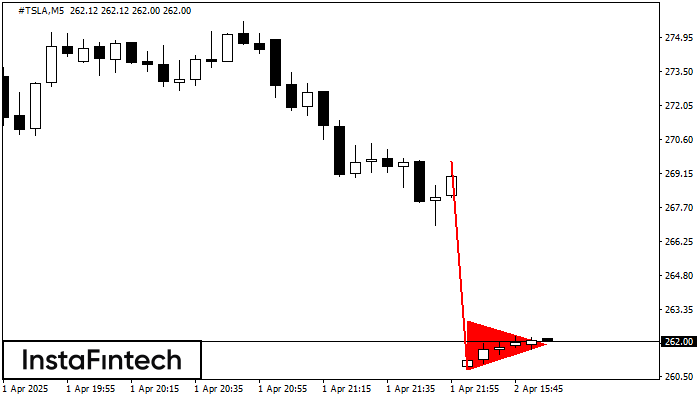
На графике #TSLA M5 сформировалась фигура «Медвежий вымпел», которая сигнализирует о возможном продолжении тренда. Характеристика: основание фигуры имеет координаты 260.80; проекция высоты флагштока равна 887 пунктов. В случае если цена преодолеет основание фигуры 260.80, то ожидается продолжение нисходящего тренда на уровень 260.65 пунктов.
Таймфреймы М5 и М15 могут иметь больше ложных точек входа.
- Все
- Все
- Bearish Rectangle
- Bearish Symmetrical Triangle
- Bearish Symmetrical Triangle
- Bullish Rectangle
- Double Top
- Double Top
- Triple Bottom
- Triple Bottom
- Triple Top
- Triple Top
- Все
- Все
- Покупка
- Продажа
- Все
- 1
- 2
- 3
- 4
- 5
Inverse Head and Shoulder
сформирован 17.05 в 05:40:01 (UTC+0)
сила сигнала 1 из 5

According to the chart of M5, #Bitcoin produced the pattern termed the Inverse Head and Shoulder. The Head is fixed at 102549.85 while the median line of the Neck
The M5 and M15 time frames may have more false entry points.
Открыть график инструмента в новом окне
Double Bottom
сформирован 17.05 в 02:15:26 (UTC+0)
сила сигнала 1 из 5

The Double Bottom pattern has been formed on #Bitcoin M5; the upper boundary is 103642.04; the lower boundary is 103357.83. The width of the pattern is 27887 points. In case
The M5 and M15 time frames may have more false entry points.
Открыть график инструмента в новом окне
Double Bottom
сформирован 16.05 в 23:45:21 (UTC+0)
сила сигнала 1 из 5

The Double Bottom pattern has been formed on #Bitcoin M5. Characteristics: the support level 103472.45; the resistance level 103745.49; the width of the pattern 27304 points. If the resistance level
The M5 and M15 time frames may have more false entry points.
Открыть график инструмента в новом окне


