

Өзекті паттерндер

Двойное дно
сформирован 02.04 в 10:30:25 (UTC+0)
сила сигнала 3 из 5
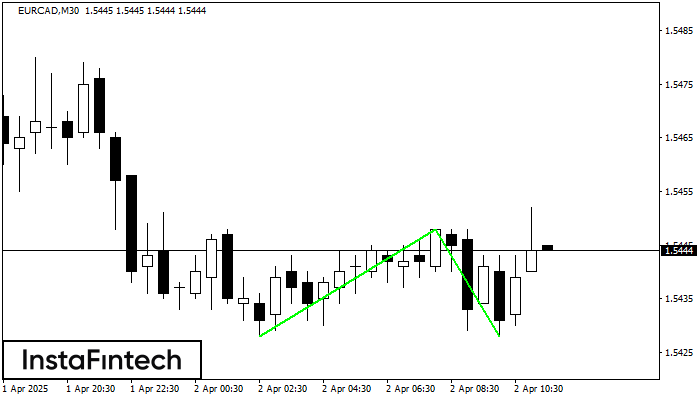
Сформирована фигура «Двойное дно» на графике EURCAD M30. Характеристика: Уровень поддержки 1.5428; Уровень сопротивления 1.5448; Ширина фигуры 20 пунктов. В случае пробоя уровня сопротивления можно будет прогнозировать изменение тенденции, где первая точка фиксации прибыли находится на расстоянии 20 пунктов.
Сондай-ақ қараңыз
- Все
- Все
- Bearish Rectangle
- Bearish Symmetrical Triangle
- Bearish Symmetrical Triangle
- Bullish Rectangle
- Double Top
- Double Top
- Triple Bottom
- Triple Bottom
- Triple Top
- Triple Top
- Все
- Все
- Покупка
- Продажа
- Все
- 1
- 2
- 3
- 4
- 5
Triple Top
was formed on 23.04 at 21:10:21 (UTC+0)
signal strength 1 of 5
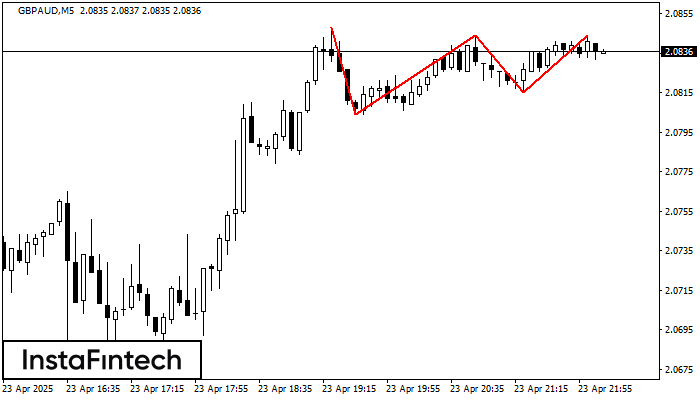
The Triple Top pattern has formed on the chart of the GBPAUD M5. Features of the pattern: borders have an ascending angle; the lower line of the pattern
The M5 and M15 time frames may have more false entry points.
Open chart in a new window
Double Bottom
was formed on 23.04 at 21:05:22 (UTC+0)
signal strength 1 of 5
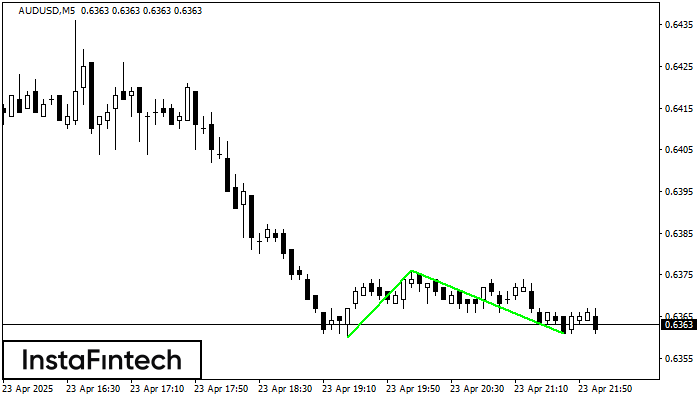
The Double Bottom pattern has been formed on AUDUSD M5; the upper boundary is 0.6376; the lower boundary is 0.6361. The width of the pattern is 16 points. In case
The M5 and M15 time frames may have more false entry points.
Open chart in a new window
Bullish Rectangle
was formed on 23.04 at 20:57:23 (UTC+0)
signal strength 1 of 5
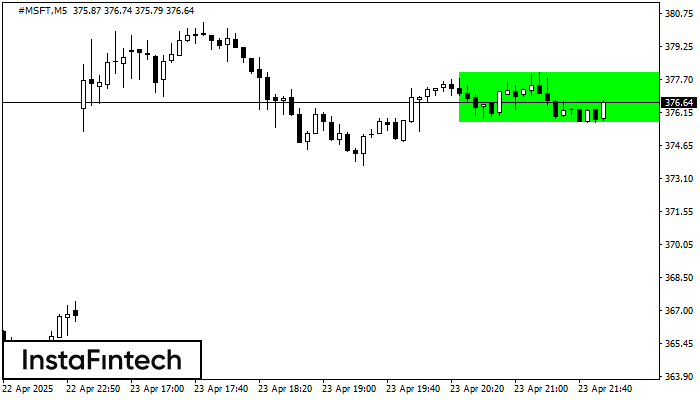
According to the chart of M5, #MSFT formed the Bullish Rectangle which is a pattern of a trend continuation. The pattern is contained within the following borders: the lower border
The M5 and M15 time frames may have more false entry points.
Open chart in a new window


