

Өзекті паттерндер

Двойная вершина
сформирован 02.04 в 04:20:22 (UTC+0)
сила сигнала 1 из 5
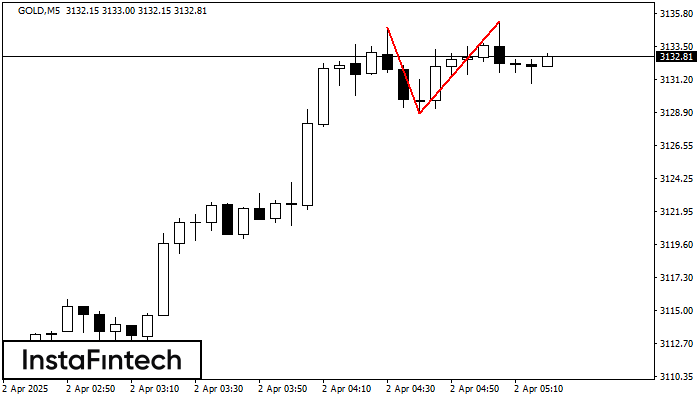
На торговом графике GOLD M5 сформировалась разворотная фигура «Двойная вершина». Характеристика: Верхняя граница 3135.25; Нижняя граница 3128.79; Ширина фигуры 646 пунктов. Сигнал: Пробой нижней границы 3128.79 приведет к дальнейшему нисходящему движению с перспективой хода к уровню 3128.64.
Таймфреймы М5 и М15 могут иметь больше ложных точек входа.
- Все
- Все
- Bearish Rectangle
- Bearish Symmetrical Triangle
- Bearish Symmetrical Triangle
- Bullish Rectangle
- Double Top
- Double Top
- Triple Bottom
- Triple Bottom
- Triple Top
- Triple Top
- Все
- Все
- Покупка
- Продажа
- Все
- 1
- 2
- 3
- 4
- 5
Double Bottom
was formed on 15.05 at 08:59:51 (UTC+0)
signal strength 3 of 5
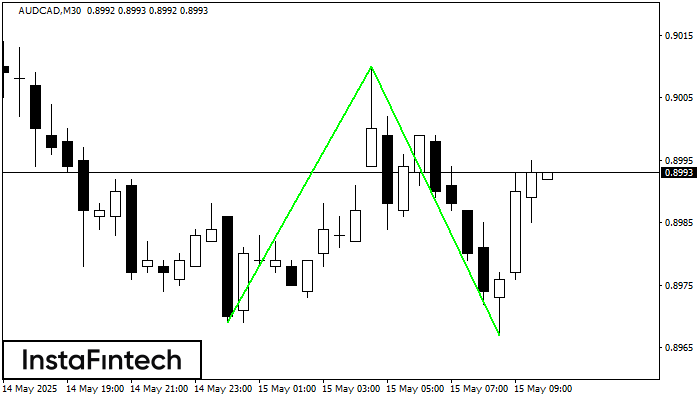
The Double Bottom pattern has been formed on AUDCAD M30. Characteristics: the support level 0.8969; the resistance level 0.9010; the width of the pattern 41 points. If the resistance level
Open chart in a new window
Double Bottom
was formed on 15.05 at 08:30:09 (UTC+0)
signal strength 3 of 5
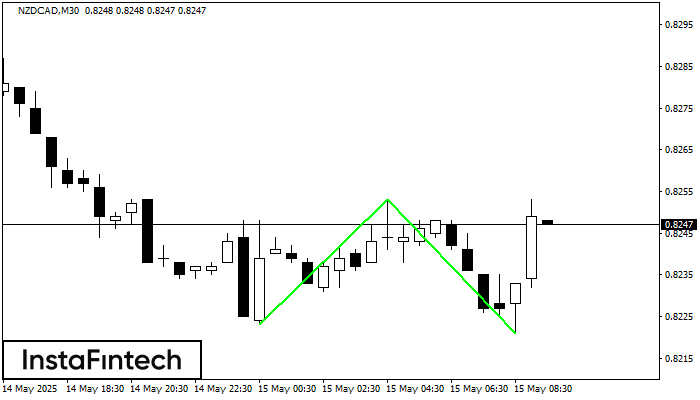
The Double Bottom pattern has been formed on NZDCAD M30. Characteristics: the support level 0.8223; the resistance level 0.8253; the width of the pattern 30 points. If the resistance level
Open chart in a new window
Bearish Rectangle
was formed on 15.05 at 06:55:13 (UTC+0)
signal strength 1 of 5

According to the chart of M5, GBPJPY formed the Bearish Rectangle. This type of a pattern indicates a trend continuation. It consists of two levels: resistance 194.04 - 0.00
The M5 and M15 time frames may have more false entry points.
Open chart in a new window


