

Өзекті паттерндер

Двойное дно
сформирован 31.03 в 15:30:34 (UTC+0)
сила сигнала 1 из 5
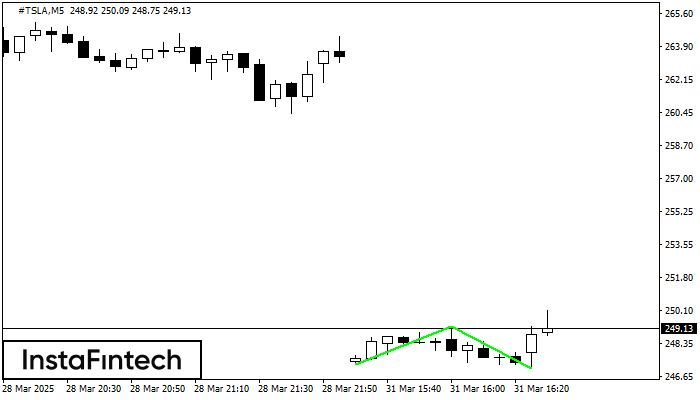
Сформирована фигура «Двойное дно» на графике #TSLA M5. Данное формирование сигнализирует об изменении тенденции с нисходящего на восходящее движение. Сигнал: Торговую позицию на покупку следует открывать после пробоя верхней границы фигуры 249.25, где перспектива будущего хода будет являться шириной текущей фигуры - 198 пунктов.
Таймфреймы М5 и М15 могут иметь больше ложных точек входа.
- Все
- Все
- Bearish Rectangle
- Bearish Symmetrical Triangle
- Bearish Symmetrical Triangle
- Bullish Rectangle
- Double Top
- Double Top
- Triple Bottom
- Triple Bottom
- Triple Top
- Triple Top
- Все
- Все
- Покупка
- Продажа
- Все
- 1
- 2
- 3
- 4
- 5
Double Bottom
was formed on 30.05 at 20:46:52 (UTC+0)
signal strength 2 of 5
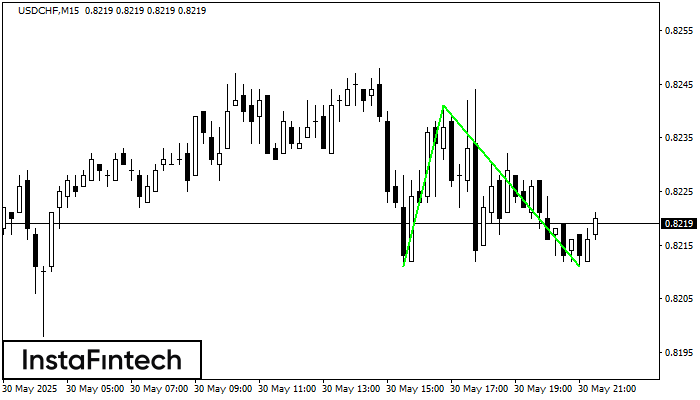
The Double Bottom pattern has been formed on USDCHF M15. Characteristics: the support level 0.8211; the resistance level 0.8241; the width of the pattern 30 points. If the resistance level
The M5 and M15 time frames may have more false entry points.
Open chart in a new window
Triple Bottom
was formed on 30.05 at 20:25:24 (UTC+0)
signal strength 1 of 5
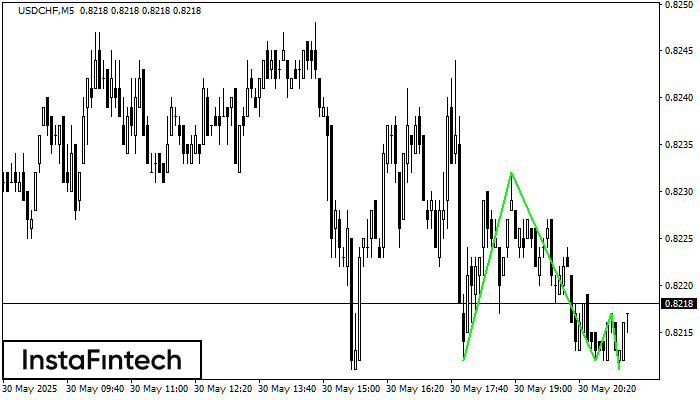
The Triple Bottom pattern has formed on the chart of the USDCHF M5 trading instrument. The pattern signals a change in the trend from downwards to upwards in the case
The M5 and M15 time frames may have more false entry points.
Open chart in a new window
Double Bottom
was formed on 30.05 at 20:10:20 (UTC+0)
signal strength 1 of 5
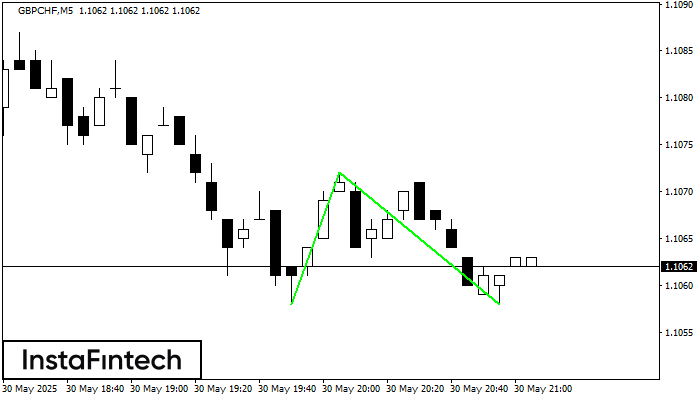
The Double Bottom pattern has been formed on GBPCHF M5. This formation signals a reversal of the trend from downwards to upwards. The signal is that a buy trade should
The M5 and M15 time frames may have more false entry points.
Open chart in a new window


