

Өзекті паттерндер

Двойное дно
сформирован 30.03 в 14:25:09 (UTC+0)
сила сигнала 1 из 5
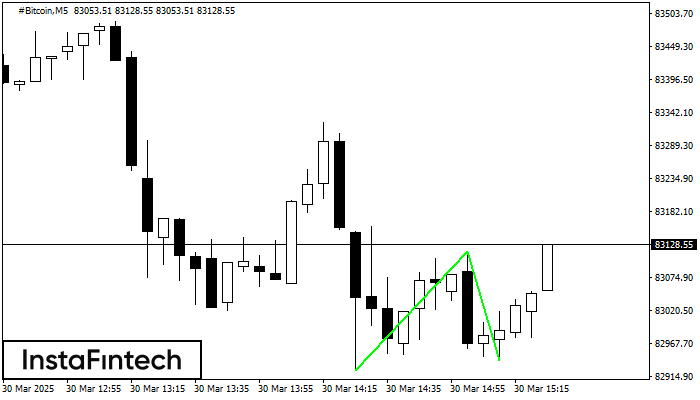
Сформирована фигура «Двойное дно» на графике #Bitcoin M5. Данное формирование сигнализирует об изменении тенденции с нисходящего на восходящее движение. Сигнал: Торговую позицию на покупку следует открывать после пробоя верхней границы фигуры 83117.65, где перспектива будущего хода будет являться шириной текущей фигуры - 19331 пунктов.
Таймфреймы М5 и М15 могут иметь больше ложных точек входа.
Сондай-ақ қараңыз
- Все
- Все
- Bearish Rectangle
- Bearish Symmetrical Triangle
- Bearish Symmetrical Triangle
- Bullish Rectangle
- Double Top
- Double Top
- Triple Bottom
- Triple Bottom
- Triple Top
- Triple Top
- Все
- Все
- Покупка
- Продажа
- Все
- 1
- 2
- 3
- 4
- 5
Bearish pennant
сформирован 15.05 в 19:01:45 (UTC+0)
сила сигнала 3 из 5
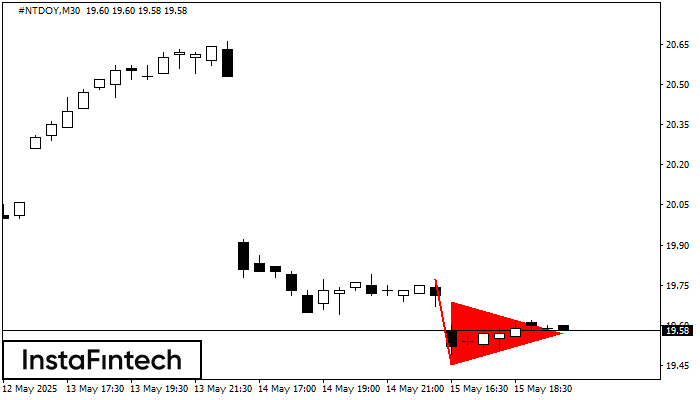
The Bearish pennant pattern has formed on the #NTDOY M30 chart. The pattern signals continuation of the downtrend in case the pennant’s low of 19.46 is broken through. Recommendations: Place
Открыть график инструмента в новом окне
Double Bottom
сформирован 15.05 в 19:01:15 (UTC+0)
сила сигнала 2 из 5
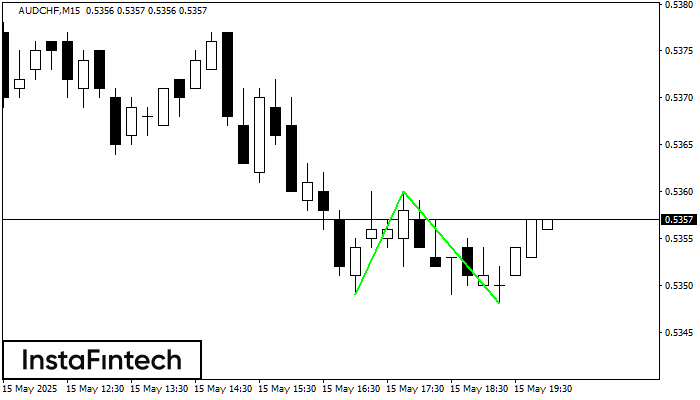
The Double Bottom pattern has been formed on AUDCHF M15. Characteristics: the support level 0.5349; the resistance level 0.5360; the width of the pattern 11 points. If the resistance level
The M5 and M15 time frames may have more false entry points.
Открыть график инструмента в новом окне
Double Top
сформирован 15.05 в 19:00:44 (UTC+0)
сила сигнала 4 из 5
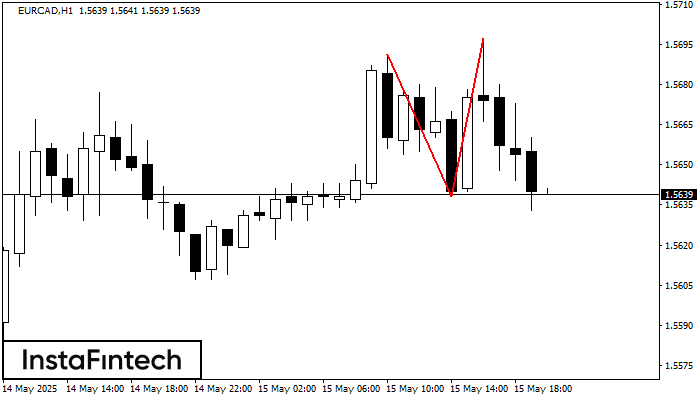
The Double Top reversal pattern has been formed on EURCAD H1. Characteristics: the upper boundary 1.5691; the lower boundary 1.5638; the width of the pattern is 59 points. Sell trades
Открыть график инструмента в новом окне


