

Өзекті паттерндер

Прямоугольник
сформирован 27.03 в 06:07:54 (UTC+0)
сила сигнала 1 из 5

Сформирована фигура «Прямоугольник» на графике USDJPY M5. Тип фигуры: Продолжение тренда; Границы: Верхняя 150.29, Нижняя 150.10; Сигнал: позиция на продажу открывается после фиксации цены ниже границы прямоугольника 150.10.
Таймфреймы М5 и М15 могут иметь больше ложных точек входа.
- Все
- Все
- Bearish Rectangle
- Bearish Symmetrical Triangle
- Bearish Symmetrical Triangle
- Bullish Rectangle
- Double Top
- Double Top
- Triple Bottom
- Triple Bottom
- Triple Top
- Triple Top
- Все
- Все
- Покупка
- Продажа
- Все
- 1
- 2
- 3
- 4
- 5
Double Bottom
сформирован 22.05 в 10:30:10 (UTC+0)
сила сигнала 3 из 5
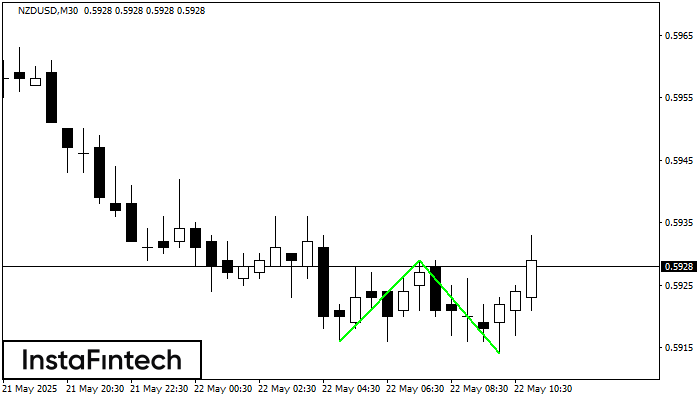
The Double Bottom pattern has been formed on NZDUSD M30. Characteristics: the support level 0.5916; the resistance level 0.5929; the width of the pattern 13 points. If the resistance level
Открыть график инструмента в новом окне
Double Bottom
сформирован 22.05 в 10:30:07 (UTC+0)
сила сигнала 2 из 5
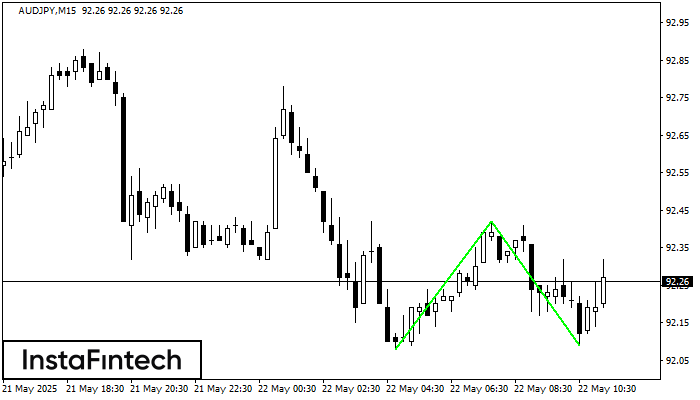
The Double Bottom pattern has been formed on AUDJPY M15. Characteristics: the support level 92.08; the resistance level 92.42; the width of the pattern 34 points. If the resistance level
The M5 and M15 time frames may have more false entry points.
Открыть график инструмента в новом окне
Double Bottom
сформирован 22.05 в 10:25:09 (UTC+0)
сила сигнала 1 из 5
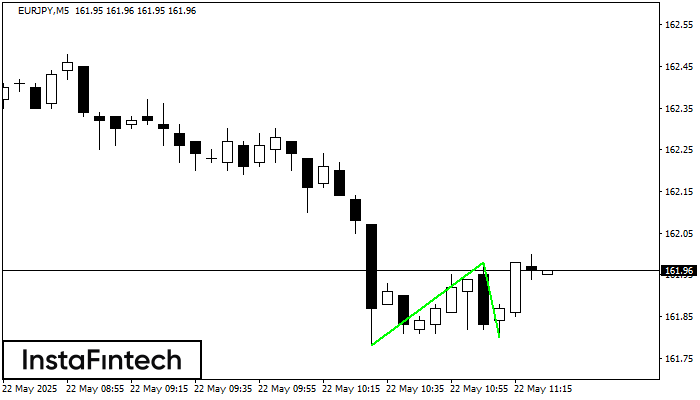
The Double Bottom pattern has been formed on EURJPY M5. Characteristics: the support level 161.78; the resistance level 161.98; the width of the pattern 20 points. If the resistance level
The M5 and M15 time frames may have more false entry points.
Открыть график инструмента в новом окне


