

Өзекті паттерндер

Медвежий симметричный треугольник
сформирован 27.03 в 03:36:20 (UTC+0)
сила сигнала 2 из 5
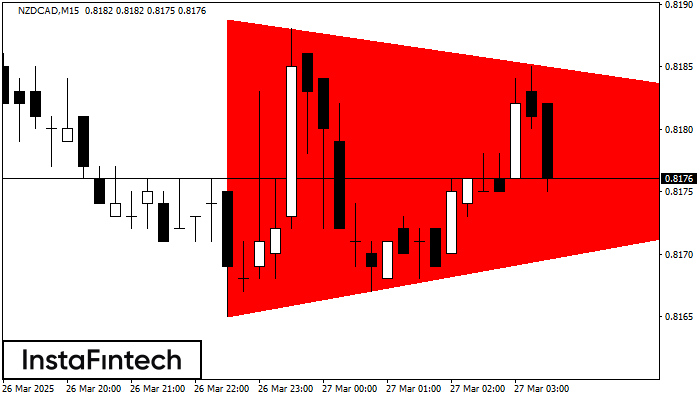
На графике NZDCAD на M15 сформировалась фигура «Медвежий симметричный треугольник». Торговые рекомендации: Пробой нижней границы 0.8165 с большой долей вероятности приведет к продолжению нисходящего тренда.
Таймфреймы М5 и М15 могут иметь больше ложных точек входа.
- Все
- Все
- Bearish Rectangle
- Bearish Symmetrical Triangle
- Bearish Symmetrical Triangle
- Bullish Rectangle
- Double Top
- Double Top
- Triple Bottom
- Triple Bottom
- Triple Top
- Triple Top
- Все
- Все
- Покупка
- Продажа
- Все
- 1
- 2
- 3
- 4
- 5
Double Bottom
сформирован 22.05 в 17:45:33 (UTC+0)
сила сигнала 2 из 5
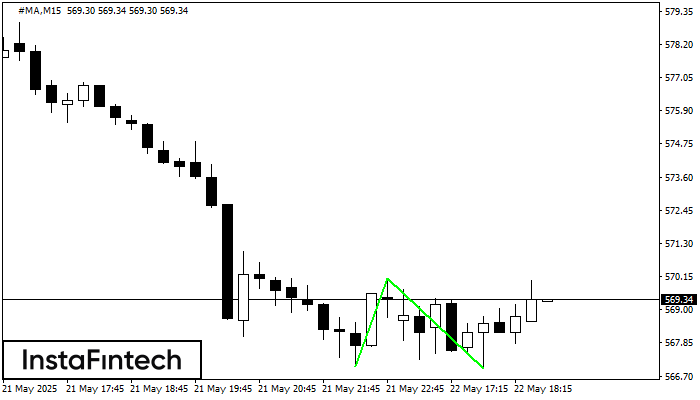
The Double Bottom pattern has been formed on #MA M15. This formation signals a reversal of the trend from downwards to upwards. The signal is that a buy trade should
The M5 and M15 time frames may have more false entry points.
Открыть график инструмента в новом окне
Double Top
сформирован 22.05 в 17:30:27 (UTC+0)
сила сигнала 1 из 5
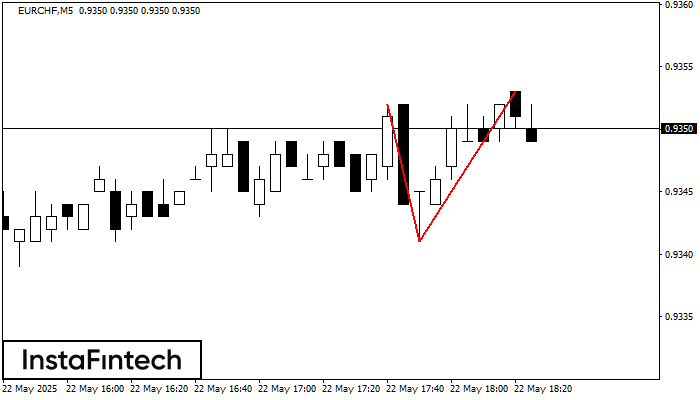
The Double Top reversal pattern has been formed on EURCHF M5. Characteristics: the upper boundary 0.9352; the lower boundary 0.9341; the width of the pattern is 12 points. Sell trades
The M5 and M15 time frames may have more false entry points.
Открыть график инструмента в новом окне
Head and Shoulders
сформирован 22.05 в 17:00:26 (UTC+0)
сила сигнала 4 из 5
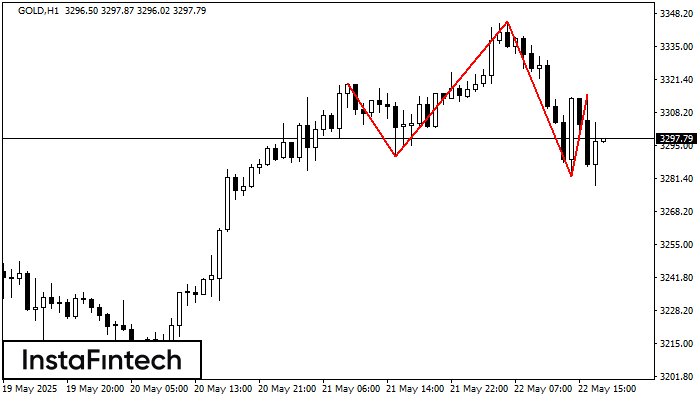
The GOLD H1 formed the Head and Shoulders pattern with the following features: The Head’s top is at 3344.99, the Neckline and the upward angle are at 3290.48/3282.56. The formation
Открыть график инструмента в новом окне


