

Өзекті паттерндер

Двойная вершина
сформирован 26.03 в 05:30:20 (UTC+0)
сила сигнала 3 из 5
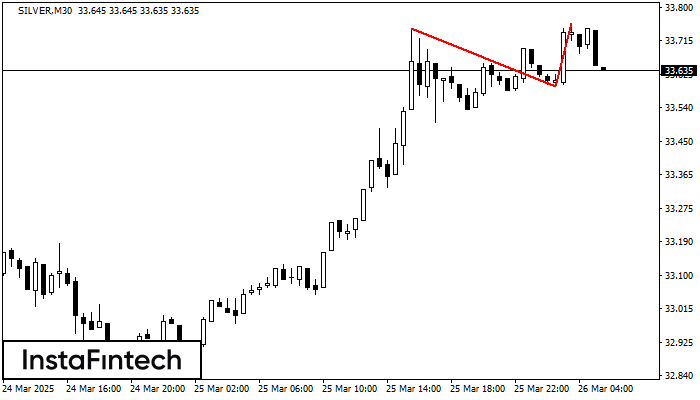
На торговом графике SILVER M30 сформировалась разворотная фигура «Двойная вершина». Характеристика: Верхняя граница 33.76; Нижняя граница 33.59; Ширина фигуры 165 пунктов. Сигнал: Пробой нижней границы 33.59 приведет к дальнейшему нисходящему движению с перспективой хода к уровню 33.56.
- Все
- Все
- Bearish Rectangle
- Bearish Symmetrical Triangle
- Bearish Symmetrical Triangle
- Bullish Rectangle
- Double Top
- Double Top
- Triple Bottom
- Triple Bottom
- Triple Top
- Triple Top
- Все
- Все
- Покупка
- Продажа
- Все
- 1
- 2
- 3
- 4
- 5
Double Bottom
сформирован 21.05 в 07:40:11 (UTC+0)
сила сигнала 1 из 5
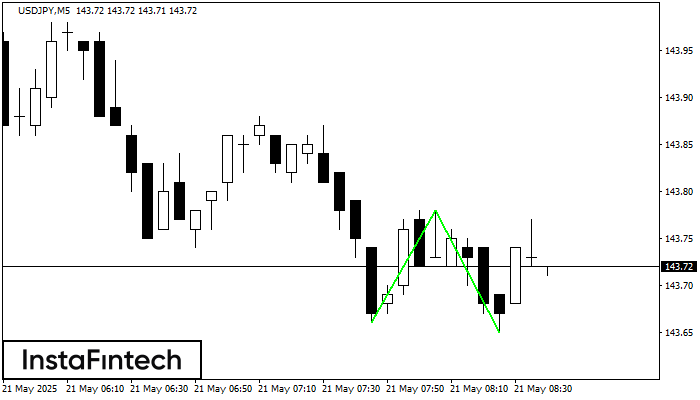
The Double Bottom pattern has been formed on USDJPY M5; the upper boundary is 143.78; the lower boundary is 143.65. The width of the pattern is 12 points. In case
The M5 and M15 time frames may have more false entry points.
Открыть график инструмента в новом окне
Double Bottom
сформирован 21.05 в 06:56:25 (UTC+0)
сила сигнала 1 из 5
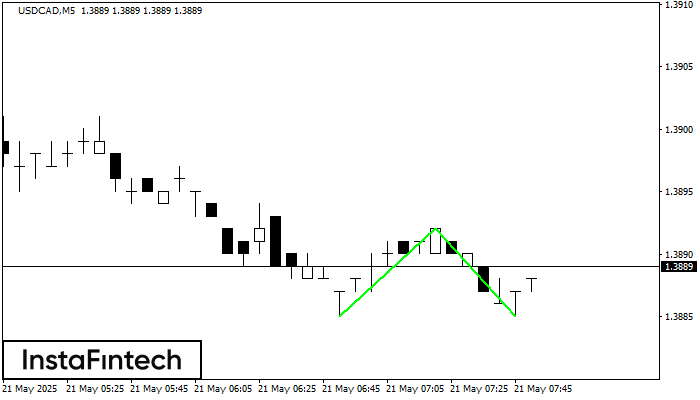
The Double Bottom pattern has been formed on USDCAD M5; the upper boundary is 1.3892; the lower boundary is 1.3885. The width of the pattern is 7 points. In case
The M5 and M15 time frames may have more false entry points.
Открыть график инструмента в новом окне
Double Bottom
сформирован 21.05 в 06:45:15 (UTC+0)
сила сигнала 2 из 5
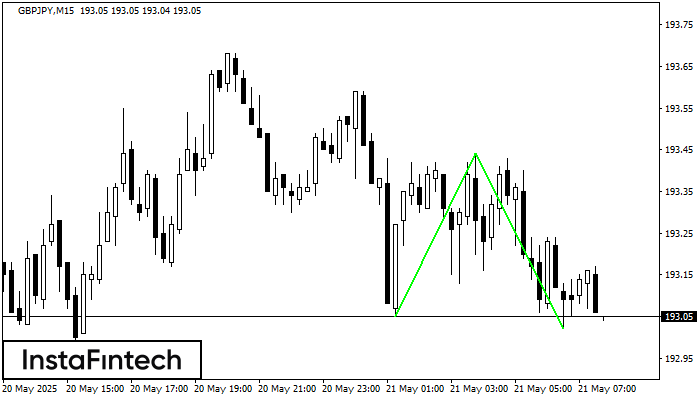
The Double Bottom pattern has been formed on GBPJPY M15; the upper boundary is 193.44; the lower boundary is 193.02. The width of the pattern is 39 points. In case
The M5 and M15 time frames may have more false entry points.
Открыть график инструмента в новом окне


