

Өзекті паттерндер

Двойное дно
сформирован 26.03 в 05:00:28 (UTC+0)
сила сигнала 4 из 5
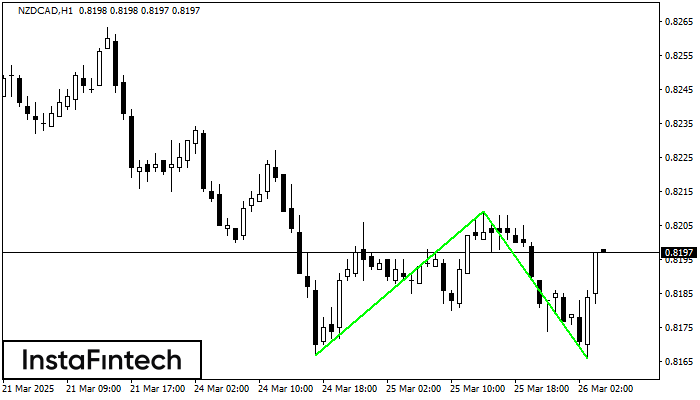
Сформирована фигура «Двойное дно» на графике NZDCAD H1. Верхняя граница 0.8209; Нижняя граница 0.8166; Ширина фигуры 42 пунктов. В случае пробоя верхней границы 0.8209 можно будет прогнозировать изменение тенденции, где ширина фигуры и будет являться расстоянием предположительного Тейк Профита.
- Все
- Все
- Bearish Rectangle
- Bearish Symmetrical Triangle
- Bearish Symmetrical Triangle
- Bullish Rectangle
- Double Top
- Double Top
- Triple Bottom
- Triple Bottom
- Triple Top
- Triple Top
- Все
- Все
- Покупка
- Продажа
- Все
- 1
- 2
- 3
- 4
- 5
Double Bottom
сформирован 17.05 в 02:15:26 (UTC+0)
сила сигнала 1 из 5

The Double Bottom pattern has been formed on #Bitcoin M5; the upper boundary is 103642.04; the lower boundary is 103357.83. The width of the pattern is 27887 points. In case
The M5 and M15 time frames may have more false entry points.
Открыть график инструмента в новом окне
Double Bottom
сформирован 16.05 в 23:45:21 (UTC+0)
сила сигнала 1 из 5

The Double Bottom pattern has been formed on #Bitcoin M5. Characteristics: the support level 103472.45; the resistance level 103745.49; the width of the pattern 27304 points. If the resistance level
The M5 and M15 time frames may have more false entry points.
Открыть график инструмента в новом окне
Double Top
сформирован 16.05 в 22:45:27 (UTC+0)
сила сигнала 2 из 5
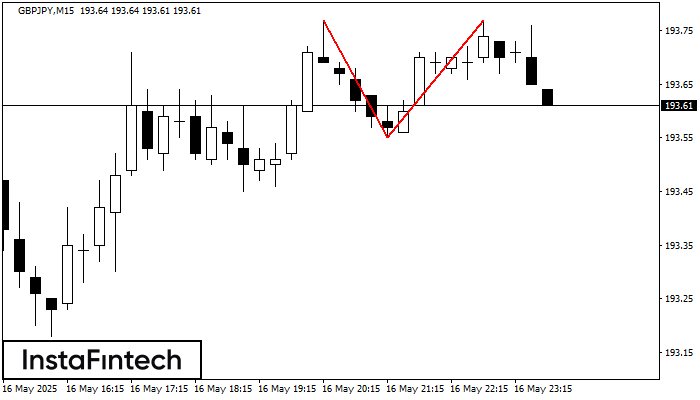
The Double Top reversal pattern has been formed on GBPJPY M15. Characteristics: the upper boundary 193.77; the lower boundary 193.55; the width of the pattern is 22 points. Sell trades
The M5 and M15 time frames may have more false entry points.
Открыть график инструмента в новом окне


