

Actual patterns

Patterns are graphical models which are formed in the chart by the price. According to one of the technical analysis postulates, history (price movement) repeats itself. It means that the price movements are often similar in the same situations which makes it possible to predict the further development of the situation with a high probability.
Relevant patterns by InstaTrade is an easy-to-use service which allows you to be aware of latest changes in the market and react to clues from the market in time. In our service you will always find the latest and most relevant patterns on any pair and any timeframe.
Double Top
was formed on 15.04 at 02:30:41 (UTC+0)
signal strength 2 of 5
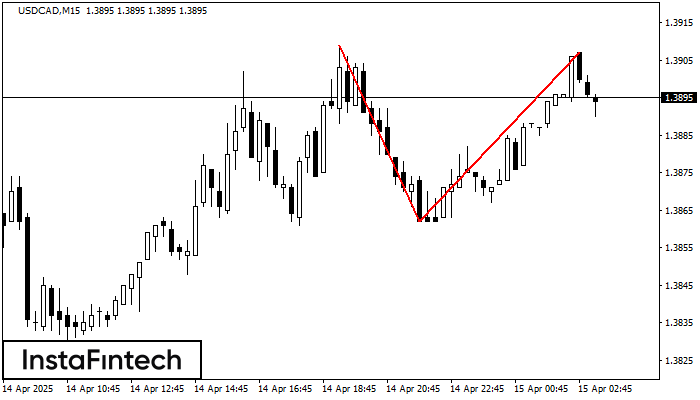
On the chart of USDCAD M15 the Double Top reversal pattern has been formed. Characteristics: the upper boundary 1.3907; the lower boundary 1.3862; the width of the pattern 45 points. The signal: a break of the lower boundary will cause continuation of the downward trend targeting the 1.3839 level.
The M5 and M15 time frames may have more false entry points.
See Also
- All
- All
- Bearish Rectangle
- Bearish Symmetrical Triangle
- Bearish Symmetrical Triangle
- Bullish Rectangle
- Double Top
- Double Top
- Triple Bottom
- Triple Bottom
- Triple Top
- Triple Top
- All
- All
- Buy
- Sale
- All
- 1
- 2
- 3
- 4
- 5
Bawah Ganda
was formed on 07.05 at 10:00:56 (UTC+0)
signal strength 2 of 5
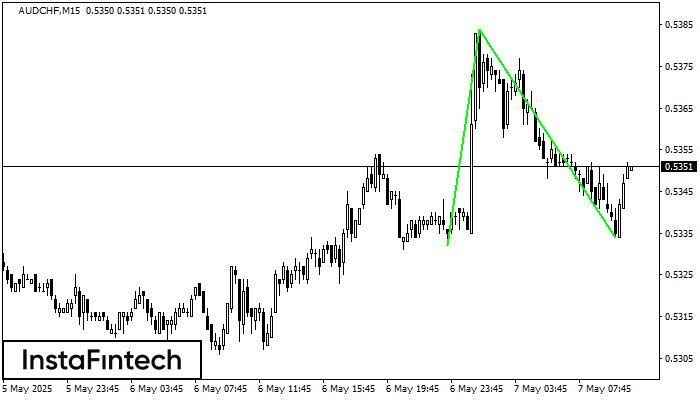
Pola Bawah Ganda telah terbentuk pada AUDCHF M15; batas atas di 0.5384; batas bawah di 0.5334. Lebar pola sebesar 52 poin. Jika harga menembus batas atas 0.5384, Perubahan dalam tren
Rangka waktu M5 dan M15 mungkin memiliki lebih dari titik entri yang keliru.
Open chart in a new window
Kepala dan Bahu Terbalik
was formed on 07.05 at 10:00:08 (UTC+0)
signal strength 3 of 5
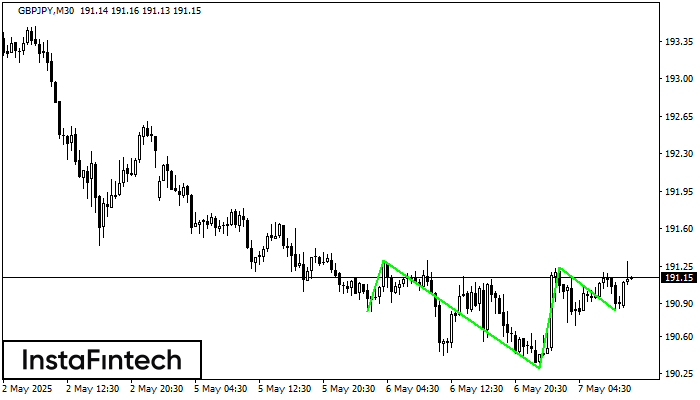
Menurut grafik M30, GBPJPY menghasilkan pola yang disebut Kepala dan Bahu Terbalik. The Head ditetapkan di 190.30 sementara garis median The Neck ditetapkan di 191.31/191.24. Formasi Pola Kepala dan Bahu
Open chart in a new window
Persegi Bullish
was formed on 07.05 at 09:17:35 (UTC+0)
signal strength 2 of 5
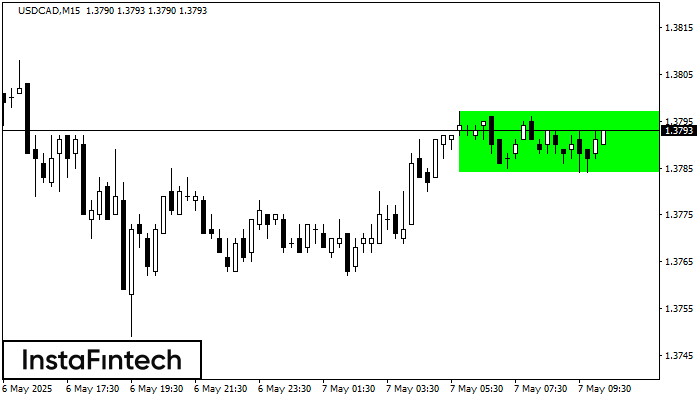
Menurut grafik dari M15, USDCAD terbentuk Persegi Bullish. Jenis pola ini menunjukkan kelanjutan tren. Terdiri dari dua tingkat: resistance 1.3797 dan support 1.3784. Jika level resistance 1.3797 - 1.3797 ditembus
Rangka waktu M5 dan M15 mungkin memiliki lebih dari titik entri yang keliru.
Open chart in a new window


