

Actual patterns

Patterns are graphical models which are formed in the chart by the price. According to one of the technical analysis postulates, history (price movement) repeats itself. It means that the price movements are often similar in the same situations which makes it possible to predict the further development of the situation with a high probability.
Relevant patterns by InstaTrade is an easy-to-use service which allows you to be aware of latest changes in the market and react to clues from the market in time. In our service you will always find the latest and most relevant patterns on any pair and any timeframe.
Triple Bottom
was formed on 04.04 at 01:30:32 (UTC+0)
signal strength 2 of 5
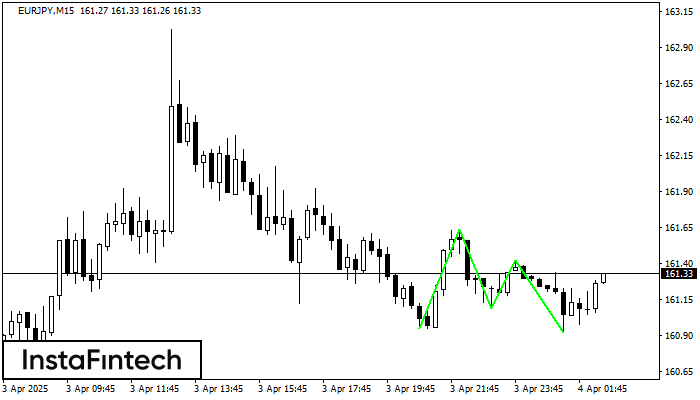
The Triple Bottom pattern has formed on the chart of EURJPY M15. Features of the pattern: The lower line of the pattern has coordinates 161.64 with the upper limit 161.64/161.42, the projection of the width is 69 points. The formation of the Triple Bottom pattern most likely indicates a change in the trend from downward to upward. This means that in the event of a breakdown of the resistance level 160.95, the price is most likely to continue the upward movement.
The M5 and M15 time frames may have more false entry points.
- All
- All
- Bearish Rectangle
- Bearish Symmetrical Triangle
- Bearish Symmetrical Triangle
- Bullish Rectangle
- Double Top
- Double Top
- Triple Bottom
- Triple Bottom
- Triple Top
- Triple Top
- All
- All
- Buy
- Sale
- All
- 1
- 2
- 3
- 4
- 5
Đáy ba
was formed on 12.05 at 06:10:15 (UTC+0)
signal strength 1 of 5
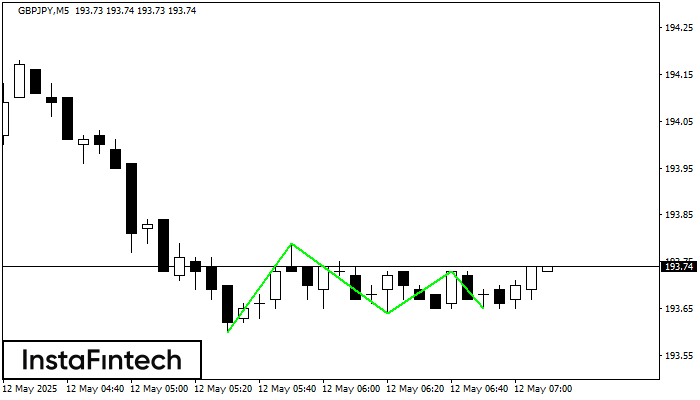
Mô hình Đáy ba đã được hình thành trên biểu đồ của GBPJPY M5. Các tính năng của mô hình: Đường dưới của mô hình có tọa độ 193.79
Khung thời gian M5 và M15 có thể có nhiều điểm vào lệnh sai hơn.
Open chart in a new window
Hình chữ nhật tăng
was formed on 12.05 at 06:00:26 (UTC+0)
signal strength 3 of 5
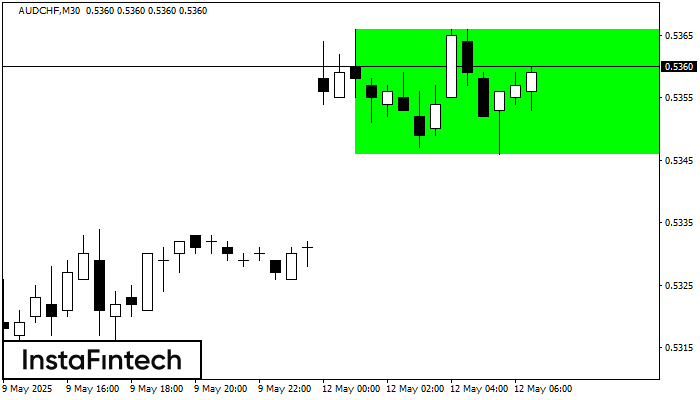
Theo biểu đồ của M30, AUDCHF đã tạo thành Hình chữ nhật tăng. Loại mô hình này cho thấy sự tiếp tục xu hướng
Open chart in a new window
Đỉnh đôi
was formed on 12.05 at 06:00:24 (UTC+0)
signal strength 4 of 5
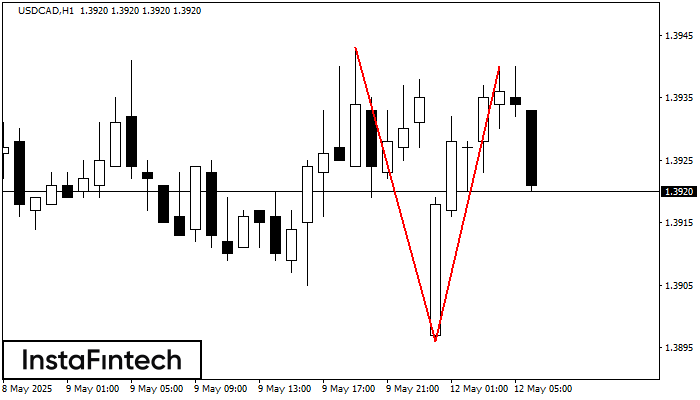
Mô hình đảo chiều Đỉnh đôi đã được hình thành trên USDCAD H1. Đặc điểm: ranh giới trên 1.3943; ranh giới dưới 1.3896; chiều rộng của mô hình
Open chart in a new window


