

Actual patterns

Patterns are graphical models which are formed in the chart by the price. According to one of the technical analysis postulates, history (price movement) repeats itself. It means that the price movements are often similar in the same situations which makes it possible to predict the further development of the situation with a high probability.
Relevant patterns by InstaTrade is an easy-to-use service which allows you to be aware of latest changes in the market and react to clues from the market in time. In our service you will always find the latest and most relevant patterns on any pair and any timeframe.
Triple Bottom
was formed on 03.04 at 18:04:53 (UTC+0)
signal strength 1 of 5
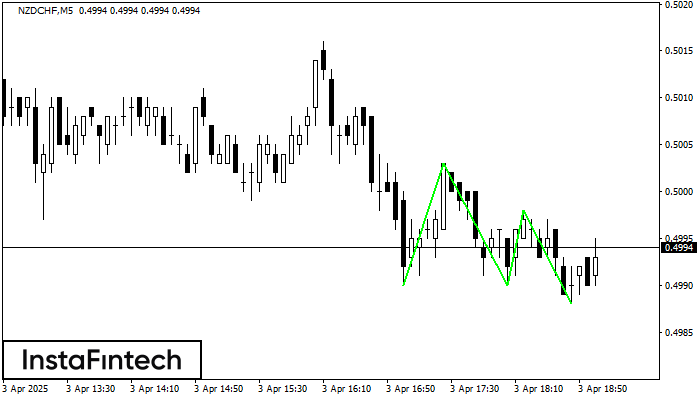
The Triple Bottom pattern has formed on the chart of NZDCHF M5. Features of the pattern: The lower line of the pattern has coordinates 0.5003 with the upper limit 0.5003/0.4998, the projection of the width is 13 points. The formation of the Triple Bottom pattern most likely indicates a change in the trend from downward to upward. This means that in the event of a breakdown of the resistance level 0.4990, the price is most likely to continue the upward movement.
The M5 and M15 time frames may have more false entry points.
- All
- All
- Bearish Rectangle
- Bearish Symmetrical Triangle
- Bearish Symmetrical Triangle
- Bullish Rectangle
- Double Top
- Double Top
- Triple Bottom
- Triple Bottom
- Triple Top
- Triple Top
- All
- All
- Buy
- Sale
- All
- 1
- 2
- 3
- 4
- 5
Bawah Triple
was formed on 08.05 at 12:20:35 (UTC+0)
signal strength 1 of 5

Pola Bawah Triple telah terbentuk pada grafik GBPCHF M5. Fitur-fitur pola: garis bawah pola memiliki koordinat 1.0970 dengan batas atas 1.0970/1.0964, proyeksi lebar adalah 14 poin. Pembentukan pola Bawah Triple
Rangka waktu M5 dan M15 mungkin memiliki lebih dari titik entri yang keliru.
Open chart in a new window
Bendera Bullish
was formed on 08.05 at 12:10:56 (UTC+0)
signal strength 2 of 5

Pola Bendera Bullish telah terbentuk di EURJPY at M15. Batas bawah pola ini terletak di 163.36/163.14, sementara batas atas terletak di 163.60/163.38. Proyeksi panjang jarum candle 62 poin. Pembentukan
Rangka waktu M5 dan M15 mungkin memiliki lebih dari titik entri yang keliru.
Open chart in a new window
Panji Bullish
was formed on 08.05 at 12:10:51 (UTC+0)
signal strength 2 of 5
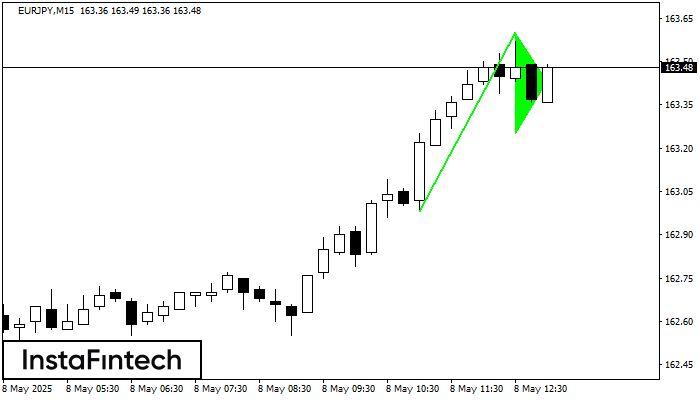
Pola grafik Panji Bullish telah terbentuk di instrumen EURJPY M15. Jenis pola ini terjadi pada kategori pola kelanjutan. Dalam kasus ini, jika kuotasi dapat menembus titik tertinggi, harga diperkirakan akan
Rangka waktu M5 dan M15 mungkin memiliki lebih dari titik entri yang keliru.
Open chart in a new window


