

Actual patterns

Patterns are graphical models which are formed in the chart by the price. According to one of the technical analysis postulates, history (price movement) repeats itself. It means that the price movements are often similar in the same situations which makes it possible to predict the further development of the situation with a high probability.
Relevant patterns by InstaTrade is an easy-to-use service which allows you to be aware of latest changes in the market and react to clues from the market in time. In our service you will always find the latest and most relevant patterns on any pair and any timeframe.
Double Bottom
was formed on 27.03 at 09:15:39 (UTC+0)
signal strength 1 of 5
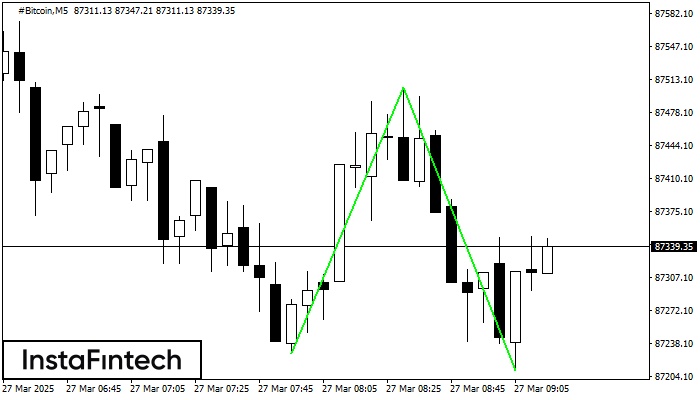
The Double Bottom pattern has been formed on #Bitcoin M5; the upper boundary is 87504.98; the lower boundary is 87210.25. The width of the pattern is 27754 points. In case of a break of the upper boundary 87504.98, a change in the trend can be predicted where the width of the pattern will coincide with the distance to a possible take profit level.
The M5 and M15 time frames may have more false entry points.
See Also
- All
- All
- Bearish Rectangle
- Bearish Symmetrical Triangle
- Bearish Symmetrical Triangle
- Bullish Rectangle
- Double Top
- Double Top
- Triple Bottom
- Triple Bottom
- Triple Top
- Triple Top
- All
- All
- Buy
- Sale
- All
- 1
- 2
- 3
- 4
- 5
รูปแบบกราฟจุดสองยอด (Double Top)
was formed on 08.04 at 18:20:17 (UTC+0)
signal strength 1 of 5

รูปแบบการย้อนตัว รูปแบบกราฟจุดสองยอด (Double Top) ได้ถูกสร้างขึ้นมาใน #KO M5 คุณลักษณะ: ขอบเขตด้านบน 69.94; ขอบเขตด้านล่าง 69.49; ความกว้างของกราฟรูปแบบนี้คือ 50 จุด
ขอบเตระยะเวลาใน M5 และ M15 อาจจะมีตำแหน่งการเข้าใช้งานที่ผิดพลาดมากยิ่งขึ้น
Open chart in a new window
รูปแบบกราฟธงขาลง (Bearish Flag)
was formed on 08.04 at 18:17:39 (UTC+0)
signal strength 1 of 5

รูปแบบ รูปแบบกราฟธงขาลง (Bearish Flag) ได้สร้างขึ้นมาในชาร์ต GOLD M5 ดังนั้นแนวโน้มขาลงอาจจะยังคงเกิดขึ้นในระยะเวลาอันสั้นนี้ จนกว่าราคาเคลื่อนตัวทะลุผ่านต่ำกว่าระดับต่ำที่ 2993.55 เทรดเดอร์ควรจะเข้าไปยังตลาด
ขอบเตระยะเวลาใน M5 และ M15 อาจจะมีตำแหน่งการเข้าใช้งานที่ผิดพลาดมากยิ่งขึ้น
Open chart in a new window
รูปแบบกราฟธงปลายแหลมขาลง (Bearish pennant)
was formed on 08.04 at 18:17:34 (UTC+0)
signal strength 1 of 5
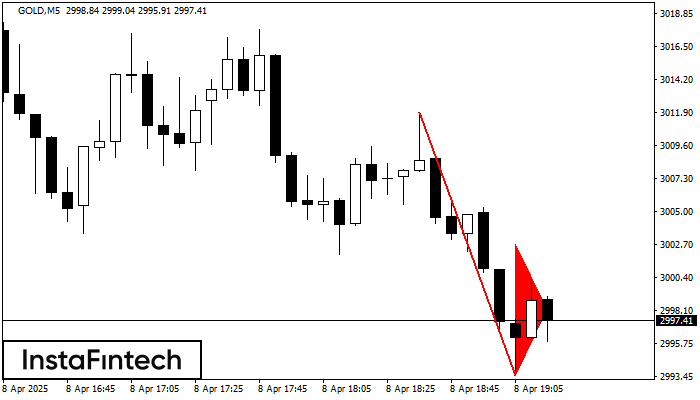
รูปแบบ รูปแบบกราฟธงปลายแหลมขาลง (Bearish pennant) ได้สร้างขึ้นมาในชาร์ต GOLD M5 รูปแบบประเภทนี้จัดว่าเป็นการชะลอตัวลงเล็กน้อย หลังจากที่ราคาจะเคลื่อนตัว ไปในทิศทางของแนวโน้มเดิม กรณีที่ราคาทรงตัวอยู่ต่ำกว่าระดับต่ำของรูปแบบใน 2993.55 เทรดเดอร์ก็จะสามารถเข้าไปถึงสถานะการขายได้สำเร็จ
ขอบเตระยะเวลาใน M5 และ M15 อาจจะมีตำแหน่งการเข้าใช้งานที่ผิดพลาดมากยิ่งขึ้น
Open chart in a new window


