

Actual patterns

Patterns are graphical models which are formed in the chart by the price. According to one of the technical analysis postulates, history (price movement) repeats itself. It means that the price movements are often similar in the same situations which makes it possible to predict the further development of the situation with a high probability.
Relevant patterns by InstaTrade is an easy-to-use service which allows you to be aware of latest changes in the market and react to clues from the market in time. In our service you will always find the latest and most relevant patterns on any pair and any timeframe.
Bearish Symmetrical Triangle
was formed on 27.03 at 03:36:21 (UTC+0)
signal strength 1 of 5
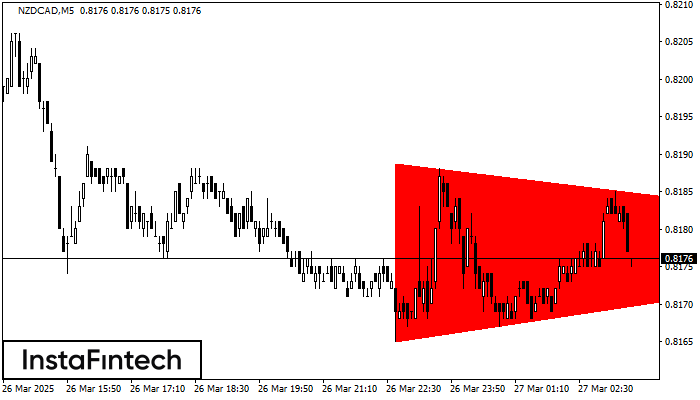
According to the chart of M5, NZDCAD formed the Bearish Symmetrical Triangle pattern. This pattern signals a further downward trend in case the lower border 0.8165 is breached. Here, a hypothetical profit will equal the width of the available pattern that is -24 pips.
The M5 and M15 time frames may have more false entry points.
- All
- All
- Bearish Rectangle
- Bearish Symmetrical Triangle
- Bearish Symmetrical Triangle
- Bullish Rectangle
- Double Top
- Double Top
- Triple Bottom
- Triple Bottom
- Triple Top
- Triple Top
- All
- All
- Buy
- Sale
- All
- 1
- 2
- 3
- 4
- 5
Đỉnh ba
was formed on 15.05 at 02:30:29 (UTC+0)
signal strength 2 of 5
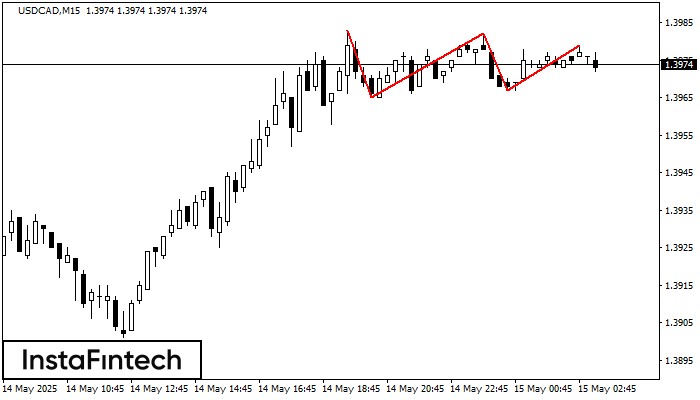
Mô hình Đỉnh ba đã được hình thành trên biểu đồ của USDCAD M15. Các đặc điểm của mô hình: đường viền có góc tăng dần; đường dưới
Khung thời gian M5 và M15 có thể có nhiều điểm vào lệnh sai hơn.
Open chart in a new window
Đáy ba
was formed on 15.05 at 02:00:35 (UTC+0)
signal strength 2 of 5
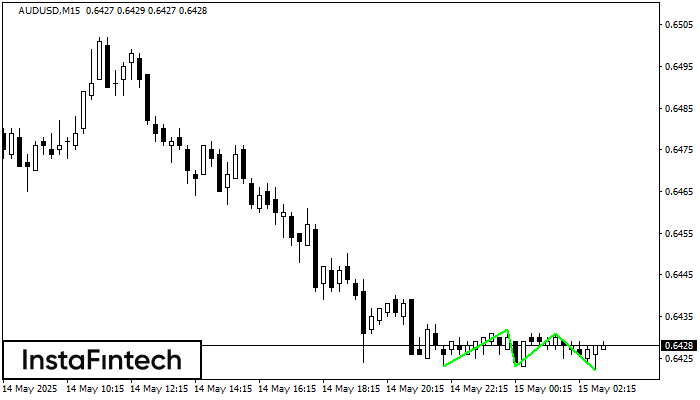
Mô hình Đáy ba đã được hình thành trên biểu đồ của công cụ giao dịch AUDUSD M15. Mô hình này báo hiệu một sự thay đổi trong xu hướng
Khung thời gian M5 và M15 có thể có nhiều điểm vào lệnh sai hơn.
Open chart in a new window
Tam giác Cân Giảm
was formed on 15.05 at 00:37:45 (UTC+0)
signal strength 1 of 5
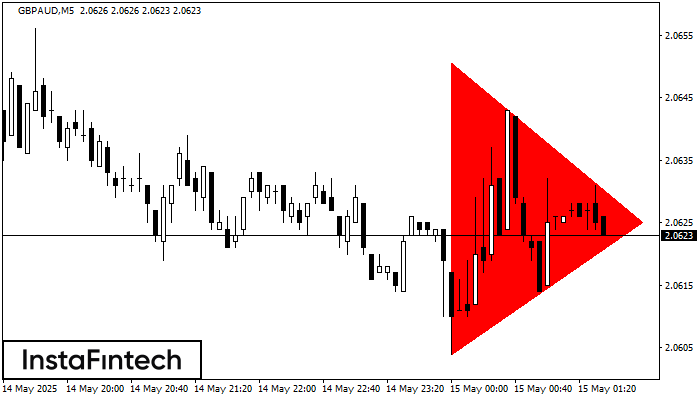
Theo biểu đồ của M5, GBPAUD đã hình thành mô hình Tam giác Cân Giảm. Khuyến nghị giao dịch: Việc vi phạm biên giới thấp hơn 2.0604 có khả năng
Khung thời gian M5 và M15 có thể có nhiều điểm vào lệnh sai hơn.
Open chart in a new window


