

वास्तविक पैटर्न

पैटर्न ग्राफिकल मॉडल हैं जो चार्ट में मूल्य से बने होते हैं। तकनीकी विश्लेषण भविष्यवाणियों में से एक के अनुसार, इतिहास का मतलब मूल्य आंदोलन खुद को दोहराता है। इसका मतलब है कि मूल्य आंदोलन अक्सर एक ही परिस्थितियों में समान होते हैं जो उच्च संभावना के साथ स्थिति के आगे के विकास की भविष्यवाणी करना संभव बनाता है।
इंस्टा फॉरेक्स द्वारा प्रासंगिक पैटर्न एक उपयोग में आसान सेवा है जो आपको बाजार में नवीनतम परिवर्तनों के बारे में जागरूक होने और समय पर बाजार से संकेतों पर प्रतिक्रिया करने की अनुमति देती है। हमारी सेवा में आप हमेशा किसी भी जोड़ी और किसी भी समय सीमा पर नवीनतम और सबसे प्रासंगिक पैटर्न प्राप्त कर सकते हैं.
Double Top
was formed on 18.04 at 11:30:37 (UTC+0)
signal strength 2 of 5
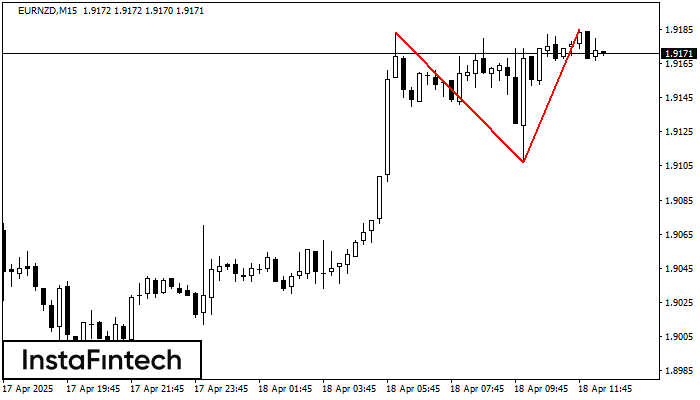
The Double Top reversal pattern has been formed on EURNZD M15. Characteristics: the upper boundary 1.9183; the lower boundary 1.9107; the width of the pattern is 78 points. Sell trades are better to be opened below the lower boundary 1.9107 with a possible movements towards the 1.9085 level.
The M5 and M15 time frames may have more false entry points.
- All
- All
- Bearish Rectangle
- Bearish Symmetrical Triangle
- Bearish Symmetrical Triangle
- Bullish Rectangle
- Double Top
- Double Top
- Triple Bottom
- Triple Bottom
- Triple Top
- Triple Top
- All
- All
- Buy
- Sale
- All
- 1
- 2
- 3
- 4
- 5
Double Bottom
was formed on 05.05 at 02:45:03 (UTC+0)
signal strength 1 of 5
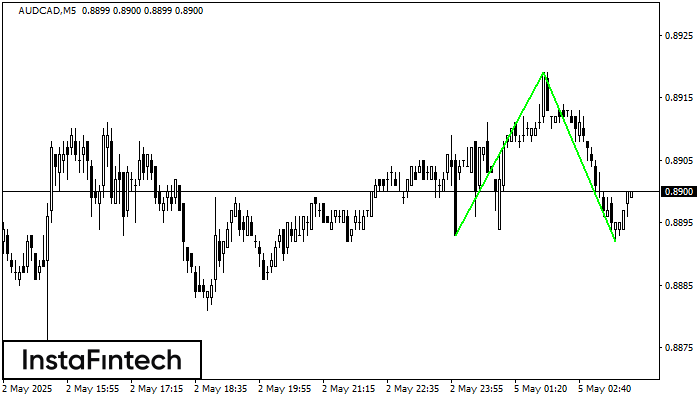
The Double Bottom pattern has been formed on AUDCAD M5. This formation signals a reversal of the trend from downwards to upwards. The signal is that a buy trade should
The M5 and M15 time frames may have more false entry points.
Open chart in a new window
Double Bottom
was formed on 05.05 at 00:30:20 (UTC+0)
signal strength 3 of 5

The Double Bottom pattern has been formed on EURCAD M30. Characteristics: the support level 1.5599; the resistance level 1.5621; the width of the pattern 22 points. If the resistance level
Open chart in a new window
Bearish Rectangle
was formed on 04.05 at 23:37:44 (UTC+0)
signal strength 1 of 5

According to the chart of M5, EURUSD formed the Bearish Rectangle. This type of a pattern indicates a trend continuation. It consists of two levels: resistance 1.1308 - 0.0000
The M5 and M15 time frames may have more false entry points.
Open chart in a new window


