

वास्तविक पैटर्न

पैटर्न ग्राफिकल मॉडल हैं जो चार्ट में मूल्य से बने होते हैं। तकनीकी विश्लेषण भविष्यवाणियों में से एक के अनुसार, इतिहास का मतलब मूल्य आंदोलन खुद को दोहराता है। इसका मतलब है कि मूल्य आंदोलन अक्सर एक ही परिस्थितियों में समान होते हैं जो उच्च संभावना के साथ स्थिति के आगे के विकास की भविष्यवाणी करना संभव बनाता है।
इंस्टा फॉरेक्स द्वारा प्रासंगिक पैटर्न एक उपयोग में आसान सेवा है जो आपको बाजार में नवीनतम परिवर्तनों के बारे में जागरूक होने और समय पर बाजार से संकेतों पर प्रतिक्रिया करने की अनुमति देती है। हमारी सेवा में आप हमेशा किसी भी जोड़ी और किसी भी समय सीमा पर नवीनतम और सबसे प्रासंगिक पैटर्न प्राप्त कर सकते हैं.
Bearish Symmetrical Triangle
was formed on 14.04 at 21:53:03 (UTC+0)
signal strength 1 of 5
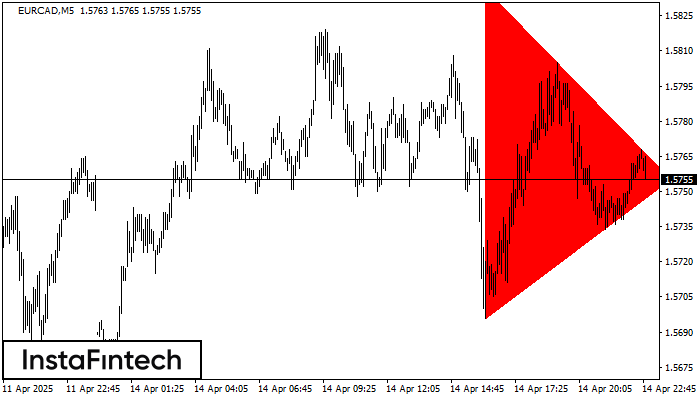
According to the chart of M5, EURCAD formed the Bearish Symmetrical Triangle pattern. This pattern signals a further downward trend in case the lower border 1.5696 is breached. Here, a hypothetical profit will equal the width of the available pattern that is -141 pips.
The M5 and M15 time frames may have more false entry points.
- All
- All
- Bearish Rectangle
- Bearish Symmetrical Triangle
- Bearish Symmetrical Triangle
- Bullish Rectangle
- Double Top
- Double Top
- Triple Bottom
- Triple Bottom
- Triple Top
- Triple Top
- All
- All
- Buy
- Sale
- All
- 1
- 2
- 3
- 4
- 5
ट्रिपल बॉटम
was formed on 06.05 at 00:20:44 (UTC+0)
signal strength 1 of 5

ट्रिपल बॉटम पैटर्न USDJPY M5 के चार्ट पर बना है। पैटर्न की विशेषताएं: पैटर्न की निचली रेखा 143.80 पर है जिसकी ऊपरी सीमा 143.80/143.76 है, प्रक्षेपण की चौड़ाई 13 पॉइंट्स
M5 और M15 समय सीमा में अधिक फाल्स एंट्री पॉइंट्स हो सकते हैं।
Open chart in a new window
डबल टॉप
was formed on 06.05 at 00:10:34 (UTC+0)
signal strength 1 of 5
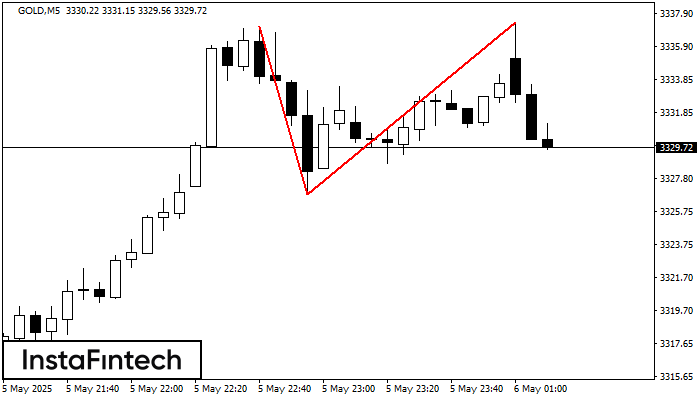
डबल टॉप पैटर्न GOLD M5 पर बना है। यह संकेत देता है कि प्रवृत्ति ऊपर से नीचे की ओर बदल गई है। संभवतः, यदि 3326.83 पैटर्न का आधार टूट जाता
M5 और M15 समय सीमा में अधिक फाल्स एंट्री पॉइंट्स हो सकते हैं।
Open chart in a new window
डबल बॉटम
was formed on 06.05 at 00:00:17 (UTC+0)
signal strength 2 of 5
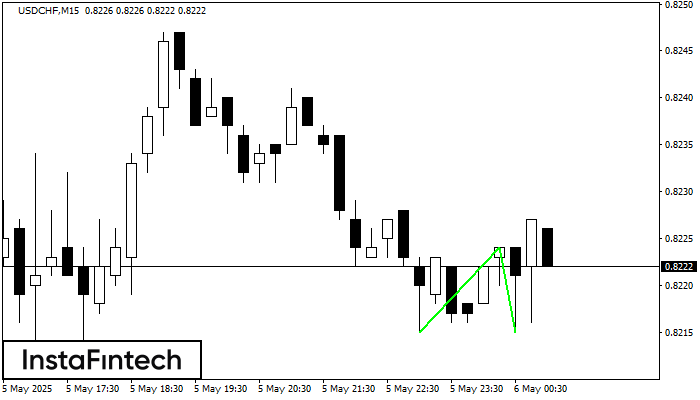
डबल बॉटम पैटर्न USDCHF M15 पर बना है; ऊपरी सीमा 0.8224 है; निचली सीमा 0.8215 है। पैटर्न की चौड़ाई 9 अंक है। ऊपरी सीमा 0.8224 के टूटने के मामले में
M5 और M15 समय सीमा में अधिक फाल्स एंट्री पॉइंट्स हो सकते हैं।
Open chart in a new window


