

वास्तविक पैटर्न

पैटर्न ग्राफिकल मॉडल हैं जो चार्ट में मूल्य से बने होते हैं। तकनीकी विश्लेषण भविष्यवाणियों में से एक के अनुसार, इतिहास का मतलब मूल्य आंदोलन खुद को दोहराता है। इसका मतलब है कि मूल्य आंदोलन अक्सर एक ही परिस्थितियों में समान होते हैं जो उच्च संभावना के साथ स्थिति के आगे के विकास की भविष्यवाणी करना संभव बनाता है।
इंस्टा फॉरेक्स द्वारा प्रासंगिक पैटर्न एक उपयोग में आसान सेवा है जो आपको बाजार में नवीनतम परिवर्तनों के बारे में जागरूक होने और समय पर बाजार से संकेतों पर प्रतिक्रिया करने की अनुमति देती है। हमारी सेवा में आप हमेशा किसी भी जोड़ी और किसी भी समय सीमा पर नवीनतम और सबसे प्रासंगिक पैटर्न प्राप्त कर सकते हैं.
Double Bottom
was formed on 11.04 at 17:34:45 (UTC+0)
signal strength 1 of 5
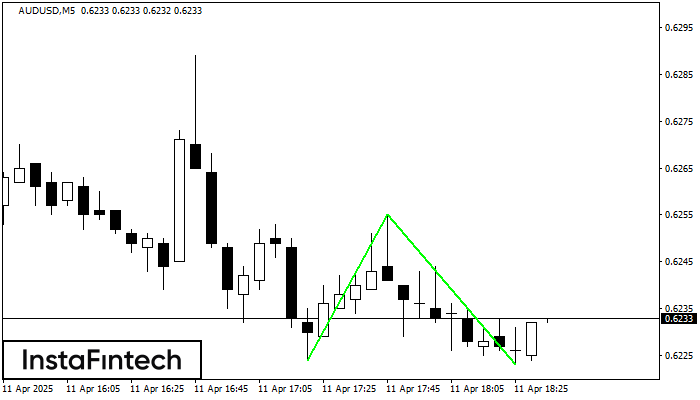
The Double Bottom pattern has been formed on AUDUSD M5. Characteristics: the support level 0.6224; the resistance level 0.6255; the width of the pattern 31 points. If the resistance level is broken, a change in the trend can be predicted with the first target point lying at the distance of 32 points.
The M5 and M15 time frames may have more false entry points.
See Also
- All
- All
- Bearish Rectangle
- Bearish Symmetrical Triangle
- Bearish Symmetrical Triangle
- Bullish Rectangle
- Double Top
- Double Top
- Triple Bottom
- Triple Bottom
- Triple Top
- Triple Top
- All
- All
- Buy
- Sale
- All
- 1
- 2
- 3
- 4
- 5
Double Bottom
was formed on 05.05 at 13:00:02 (UTC+0)
signal strength 2 of 5
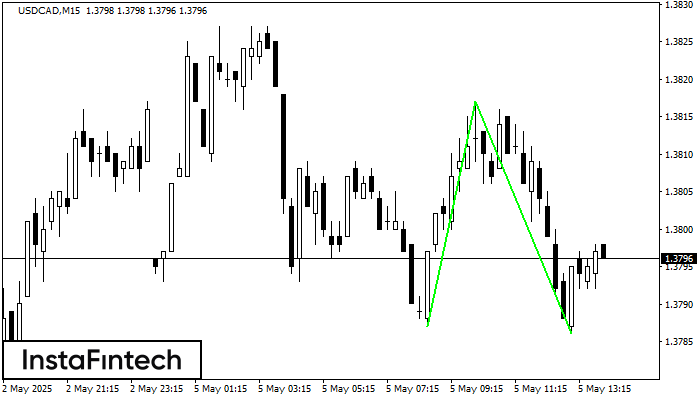
The Double Bottom pattern has been formed on USDCAD M15; the upper boundary is 1.3817; the lower boundary is 1.3786. The width of the pattern is 30 points. In case
The M5 and M15 time frames may have more false entry points.
Open chart in a new window
Double Bottom
was formed on 05.05 at 12:20:14 (UTC+0)
signal strength 1 of 5
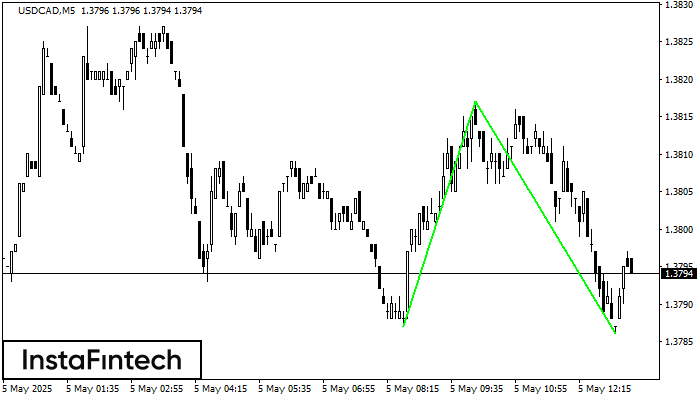
The Double Bottom pattern has been formed on USDCAD M5; the upper boundary is 1.3817; the lower boundary is 1.3786. The width of the pattern is 30 points. In case
The M5 and M15 time frames may have more false entry points.
Open chart in a new window
Double Top
was formed on 05.05 at 12:19:52 (UTC+0)
signal strength 1 of 5
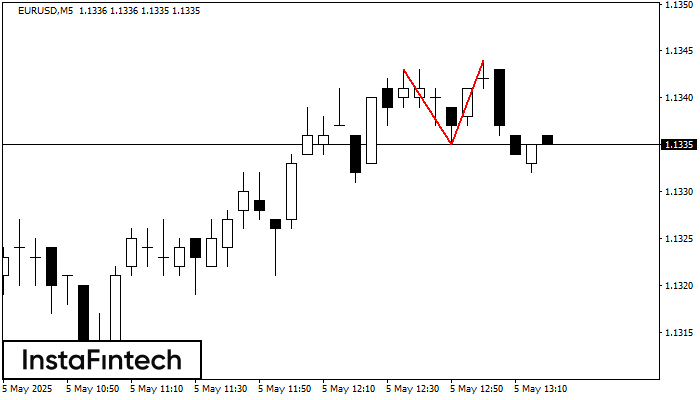
On the chart of EURUSD M5 the Double Top reversal pattern has been formed. Characteristics: the upper boundary 1.1344; the lower boundary 1.1335; the width of the pattern 9 points
The M5 and M15 time frames may have more false entry points.
Open chart in a new window


