

वास्तविक पैटर्न

पैटर्न ग्राफिकल मॉडल हैं जो चार्ट में मूल्य से बने होते हैं। तकनीकी विश्लेषण भविष्यवाणियों में से एक के अनुसार, इतिहास का मतलब मूल्य आंदोलन खुद को दोहराता है। इसका मतलब है कि मूल्य आंदोलन अक्सर एक ही परिस्थितियों में समान होते हैं जो उच्च संभावना के साथ स्थिति के आगे के विकास की भविष्यवाणी करना संभव बनाता है।
इंस्टा फॉरेक्स द्वारा प्रासंगिक पैटर्न एक उपयोग में आसान सेवा है जो आपको बाजार में नवीनतम परिवर्तनों के बारे में जागरूक होने और समय पर बाजार से संकेतों पर प्रतिक्रिया करने की अनुमति देती है। हमारी सेवा में आप हमेशा किसी भी जोड़ी और किसी भी समय सीमा पर नवीनतम और सबसे प्रासंगिक पैटर्न प्राप्त कर सकते हैं.
Bullish Rectangle
was formed on 08.04 at 08:41:05 (UTC+0)
signal strength 1 of 5
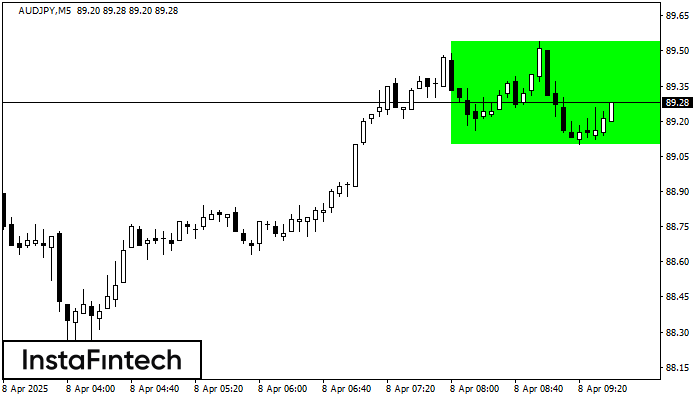
According to the chart of M5, AUDJPY formed the Bullish Rectangle. This type of a pattern indicates a trend continuation. It consists of two levels: resistance 89.54 and support 89.10. In case the resistance level 89.54 - 89.54 is broken, the instrument is likely to follow the bullish trend.
The M5 and M15 time frames may have more false entry points.
- All
- All
- Bearish Rectangle
- Bearish Symmetrical Triangle
- Bearish Symmetrical Triangle
- Bullish Rectangle
- Double Top
- Double Top
- Triple Bottom
- Triple Bottom
- Triple Top
- Triple Top
- All
- All
- Buy
- Sale
- All
- 1
- 2
- 3
- 4
- 5
বিয়ারিশ সিমেট্রিক্যাল ট্রায়াঙ্গেল
was formed on 04.05 at 09:04:31 (UTC+0)
signal strength 2 of 5

M15 এর চার্ট অনুযায়ী, #Bitcoin বিয়ারিশ সিমেট্রিক্যাল ট্রায়াঙ্গেল প্যাটার্ন গঠন করেছে। ট্রেডিংয়ের পরামর্শ: 95528.76 এর নীচের সীমানা লঙ্ঘন করা হলে নিম্নমুখী প্রবণতা অব্যাহত রাখতে উৎসাহিত করবে।
M5 এবং M15 টাইম ফ্রেমে আরও ভুল এন্ট্রি পয়েন্ট থাকতে পারে।
Open chart in a new window
বিয়ারিশ রেক্ট্যাঙ্গেল
was formed on 04.05 at 00:51:55 (UTC+0)
signal strength 3 of 5

M30 চার্ট অনুযায়ী, #Bitcoin বিয়ারিশ রেক্ট্যাঙ্গেল গঠন করেছে। এই প্যাটার্ন চলমান প্রবণতার ধারাবাহিকতা নির্দেশ করে। এটি দুটি স্তর নিয়ে গঠিত: 96456.78 - 0.00-এর রেজিস্ট্যান্স এবং 95805.26 - 95805.26-এর সাপোর্ট৷ 95805.26
Open chart in a new window
ডাবল বটম
was formed on 03.05 at 10:45:44 (UTC+0)
signal strength 2 of 5

M15 চার্টে, #Bitcoin-এর ডাবল বটম প্যাটার্নটি গঠিত হয়েছে। এই প্যাটার্নের গঠন এই সংকেত প্রদান করে যে মূল্য বিপরীতমুখী হয়ে নিম্নমুখী থেকে ঊর্ধ্বমুখী প্রবণতা প্রদর্শন করবে। এই প্যাটার্নের উপরের সীমানা 96350.17
M5 এবং M15 টাইম ফ্রেমে আরও ভুল এন্ট্রি পয়েন্ট থাকতে পারে।
Open chart in a new window


