

वास्तविक पैटर्न

पैटर्न ग्राफिकल मॉडल हैं जो चार्ट में मूल्य से बने होते हैं। तकनीकी विश्लेषण भविष्यवाणियों में से एक के अनुसार, इतिहास का मतलब मूल्य आंदोलन खुद को दोहराता है। इसका मतलब है कि मूल्य आंदोलन अक्सर एक ही परिस्थितियों में समान होते हैं जो उच्च संभावना के साथ स्थिति के आगे के विकास की भविष्यवाणी करना संभव बनाता है।
इंस्टा फॉरेक्स द्वारा प्रासंगिक पैटर्न एक उपयोग में आसान सेवा है जो आपको बाजार में नवीनतम परिवर्तनों के बारे में जागरूक होने और समय पर बाजार से संकेतों पर प्रतिक्रिया करने की अनुमति देती है। हमारी सेवा में आप हमेशा किसी भी जोड़ी और किसी भी समय सीमा पर नवीनतम और सबसे प्रासंगिक पैटर्न प्राप्त कर सकते हैं.
Bearish Symmetrical Triangle
was formed on 07.04 at 22:30:31 (UTC+0)
signal strength 1 of 5
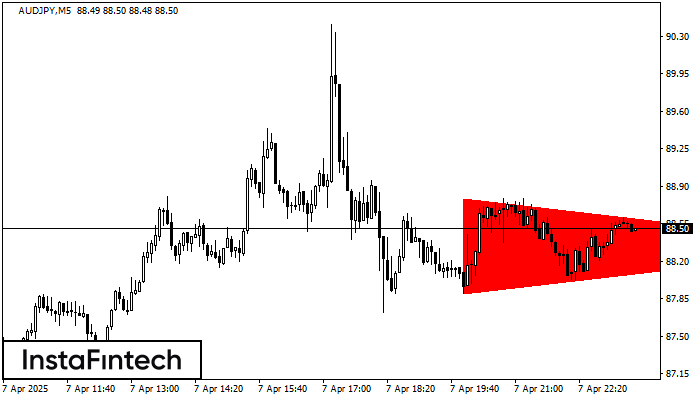
According to the chart of M5, AUDJPY formed the Bearish Symmetrical Triangle pattern. Trading recommendations: A breach of the lower border 87.90 is likely to encourage a continuation of the downward trend.
The M5 and M15 time frames may have more false entry points.
- All
- All
- Bearish Rectangle
- Bearish Symmetrical Triangle
- Bearish Symmetrical Triangle
- Bullish Rectangle
- Double Top
- Double Top
- Triple Bottom
- Triple Bottom
- Triple Top
- Triple Top
- All
- All
- Buy
- Sale
- All
- 1
- 2
- 3
- 4
- 5
डबल बॉटम
was formed on 11.04 at 12:00:06 (UTC+0)
signal strength 1 of 5
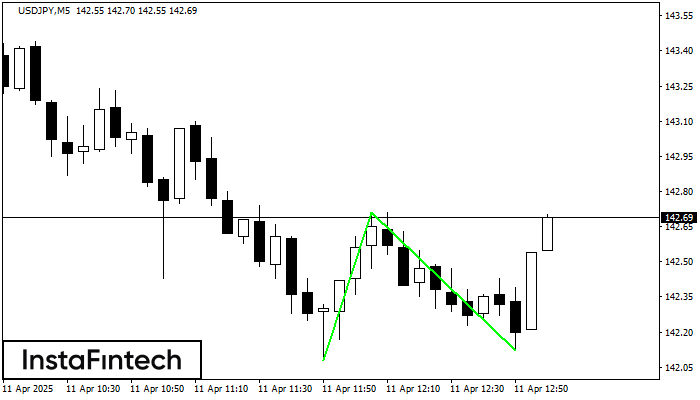
डबल बॉटम पैटर्न USDJPY M5 पर बना है। विशेषताएं: समर्थन स्तर 142.08; प्रतिरोध स्तर 142.71; पैटर्न की चौड़ाई 63 पॉइंट्स। यदि प्रतिरोध स्तर टूट जाता है, तो रुझान में बदलाव
M5 और M15 समय सीमा में अधिक फाल्स एंट्री पॉइंट्स हो सकते हैं।
Open chart in a new window
डबल बॉटम
was formed on 11.04 at 11:59:58 (UTC+0)
signal strength 3 of 5
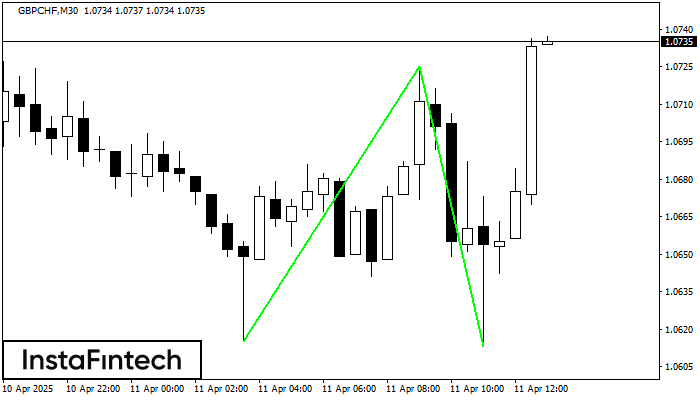
डबल बॉटम पैटर्न GBPCHF M30 पर बना है; ऊपरी सीमा 1.0725 है; निचली सीमा 1.0613 है। पैटर्न की चौड़ाई 110 अंक है। ऊपरी सीमा 1.0725 के टूटने के मामले में
Open chart in a new window
डबल बॉटम
was formed on 11.04 at 11:59:54 (UTC+0)
signal strength 4 of 5
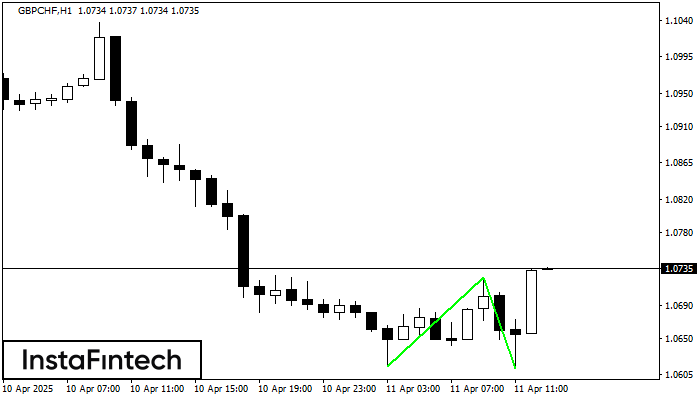
डबल बॉटम पैटर्न GBPCHF H1 पर बना है; ऊपरी सीमा 1.0725 है; निचली सीमा 1.0613 है। पैटर्न की चौड़ाई 110 अंक है। ऊपरी सीमा 1.0725 के टूटने के मामले में
Open chart in a new window


