

वास्तविक पैटर्न

पैटर्न ग्राफिकल मॉडल हैं जो चार्ट में मूल्य से बने होते हैं। तकनीकी विश्लेषण भविष्यवाणियों में से एक के अनुसार, इतिहास का मतलब मूल्य आंदोलन खुद को दोहराता है। इसका मतलब है कि मूल्य आंदोलन अक्सर एक ही परिस्थितियों में समान होते हैं जो उच्च संभावना के साथ स्थिति के आगे के विकास की भविष्यवाणी करना संभव बनाता है।
इंस्टा फॉरेक्स द्वारा प्रासंगिक पैटर्न एक उपयोग में आसान सेवा है जो आपको बाजार में नवीनतम परिवर्तनों के बारे में जागरूक होने और समय पर बाजार से संकेतों पर प्रतिक्रिया करने की अनुमति देती है। हमारी सेवा में आप हमेशा किसी भी जोड़ी और किसी भी समय सीमा पर नवीनतम और सबसे प्रासंगिक पैटर्न प्राप्त कर सकते हैं.
Bullish Symmetrical Triangle
was formed on 04.04 at 05:20:08 (UTC+0)
signal strength 1 of 5

According to the chart of M5, #Bitcoin formed the Bullish Symmetrical Triangle pattern. Description: This is the pattern of a trend continuation. 83376.14 and 82331.42 are the coordinates of the upper and lower borders respectively. The pattern width is measured on the chart at 104472 pips. Outlook: If the upper border 83376.14 is broken, the price is likely to continue its move by 82907.57.
The M5 and M15 time frames may have more false entry points.
- All
- All
- Bearish Rectangle
- Bearish Symmetrical Triangle
- Bearish Symmetrical Triangle
- Bullish Rectangle
- Double Top
- Double Top
- Triple Bottom
- Triple Bottom
- Triple Top
- Triple Top
- All
- All
- Buy
- Sale
- All
- 1
- 2
- 3
- 4
- 5
डबल टॉप
was formed on 09.05 at 08:30:08 (UTC+0)
signal strength 1 of 5
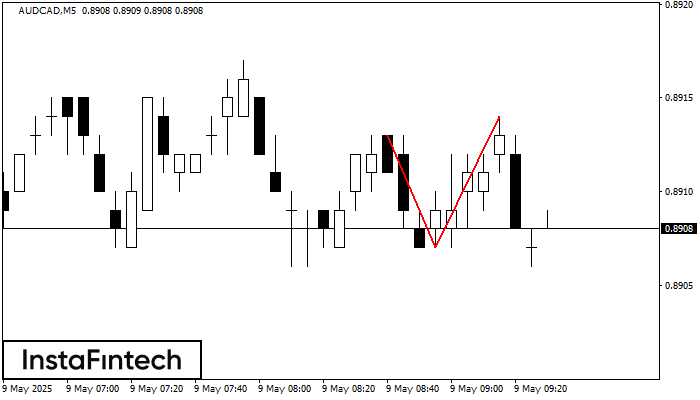
डबल टॉप पैटर्न AUDCAD M5 पर बना है। यह संकेत देता है कि प्रवृत्ति ऊपर से नीचे की ओर बदल गई है। संभवतः, यदि 0.8907 पैटर्न का आधार टूट जाता
M5 और M15 समय सीमा में अधिक फाल्स एंट्री पॉइंट्स हो सकते हैं।
Open chart in a new window
इन्वर्स हेड एण्ड शोल्डर्स
was formed on 09.05 at 08:30:02 (UTC+0)
signal strength 3 of 5
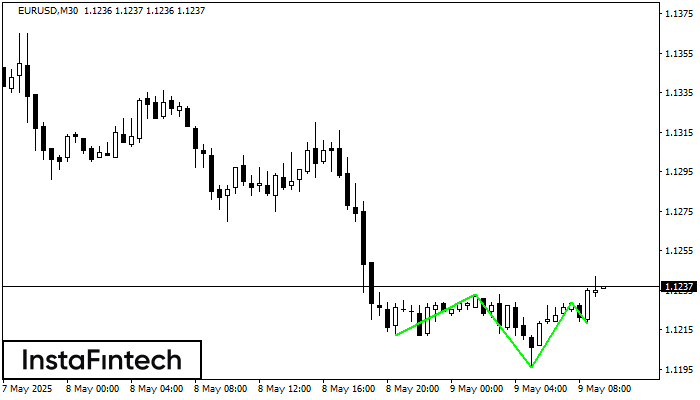
M30 के अनुसार, EURUSD तकनीकी पैटर्न - इन्वर्स हेड एण्ड शोल्डर्स को आकार दे रहा है। यदि नेकलाइन 1.1233/1.1229 टूट जाती है, तो इंस्ट्रूमेंट के 1.1259 की ओर बढ़ने की
Open chart in a new window
इन्वर्स हेड एण्ड शोल्डर्स
was formed on 09.05 at 08:29:53 (UTC+0)
signal strength 3 of 5
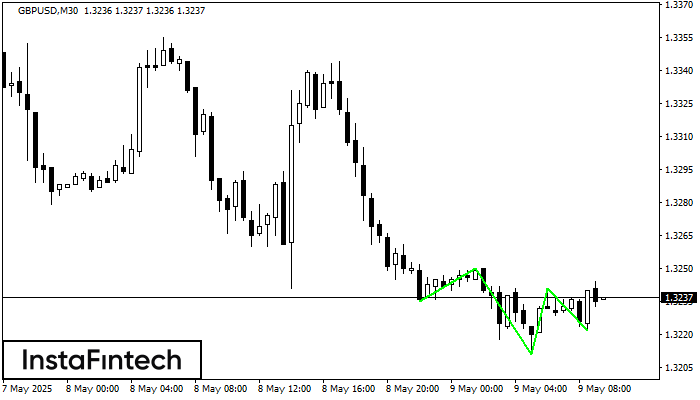
M30 के चार्ट के अनुसार, GBPUSD से इन्वर्स हेड एण्ड शोल्डर्स पैटर्न बना। हेड 1.3211 पर स्थित है जबकि नेक की मध्य रेखा 1.3250/1.3241 पर सेट है। इन्वर्स हेड एण्ड
Open chart in a new window


