

वास्तविक पैटर्न

पैटर्न ग्राफिकल मॉडल हैं जो चार्ट में मूल्य से बने होते हैं। तकनीकी विश्लेषण भविष्यवाणियों में से एक के अनुसार, इतिहास का मतलब मूल्य आंदोलन खुद को दोहराता है। इसका मतलब है कि मूल्य आंदोलन अक्सर एक ही परिस्थितियों में समान होते हैं जो उच्च संभावना के साथ स्थिति के आगे के विकास की भविष्यवाणी करना संभव बनाता है।
इंस्टा फॉरेक्स द्वारा प्रासंगिक पैटर्न एक उपयोग में आसान सेवा है जो आपको बाजार में नवीनतम परिवर्तनों के बारे में जागरूक होने और समय पर बाजार से संकेतों पर प्रतिक्रिया करने की अनुमति देती है। हमारी सेवा में आप हमेशा किसी भी जोड़ी और किसी भी समय सीमा पर नवीनतम और सबसे प्रासंगिक पैटर्न प्राप्त कर सकते हैं.
Bearish pennant
was formed on 31.03 at 01:30:12 (UTC+0)
signal strength 2 of 5
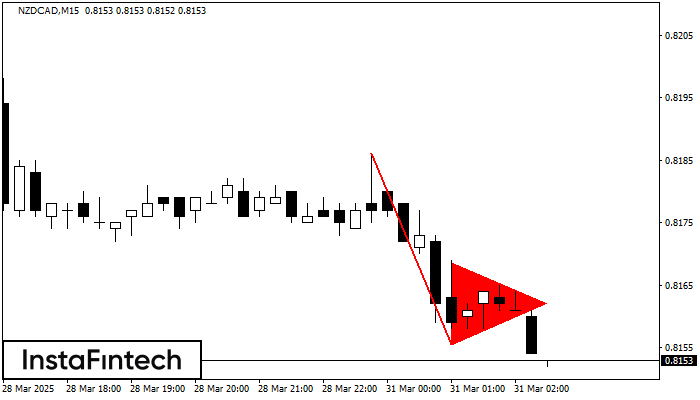
The Bearish pennant pattern has formed on the NZDCAD M15 chart. This pattern type is characterized by a slight slowdown after which the price will move in the direction of the original trend. In case the price fixes below the pattern’s low of 0.8156, a trader will be able to successfully enter the sell position.
The M5 and M15 time frames may have more false entry points.
See Also
- All
- All
- Bearish Rectangle
- Bearish Symmetrical Triangle
- Bearish Symmetrical Triangle
- Bullish Rectangle
- Double Top
- Double Top
- Triple Bottom
- Triple Bottom
- Triple Top
- Triple Top
- All
- All
- Buy
- Sale
- All
- 1
- 2
- 3
- 4
- 5
Segitiga Simetris Bearish
was formed on 08.05 at 00:20:32 (UTC+0)
signal strength 1 of 5
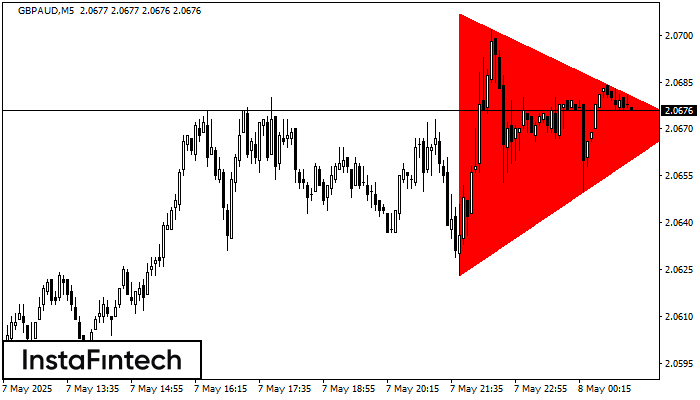
Menurut Grafik dari M5, GBPAUD dibentuk pola Segitiga Simetris Bearish. Rekomendasi Trading: Penembusan dari batas yang lebih rendah 2.0623 kemungkinan akan mendorong kelanjutan dari tren penurunan
Rangka waktu M5 dan M15 mungkin memiliki lebih dari titik entri yang keliru.
Open chart in a new window
Bawah Ganda
was formed on 08.05 at 00:05:16 (UTC+0)
signal strength 1 of 5
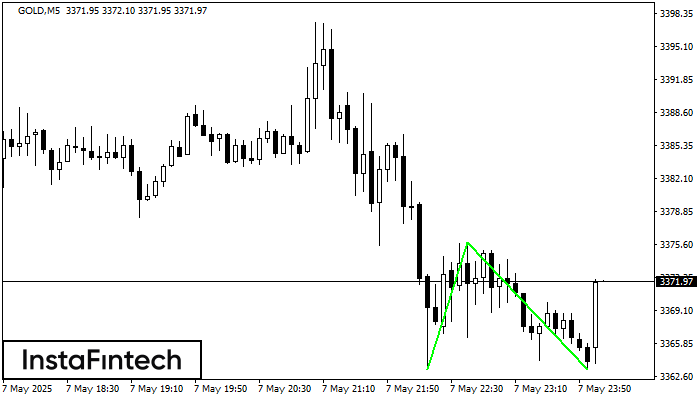
Pola Bawah Ganda telah terbentuk pada GOLD M5; batas atas di 3375.87; batas bawah di 3363.32. Lebar pola sebesar 1258 poin. Jika harga menembus batas atas 3375.87, Perubahan dalam tren
Rangka waktu M5 dan M15 mungkin memiliki lebih dari titik entri yang keliru.
Open chart in a new window
Bawah Triple
was formed on 07.05 at 23:25:32 (UTC+0)
signal strength 1 of 5
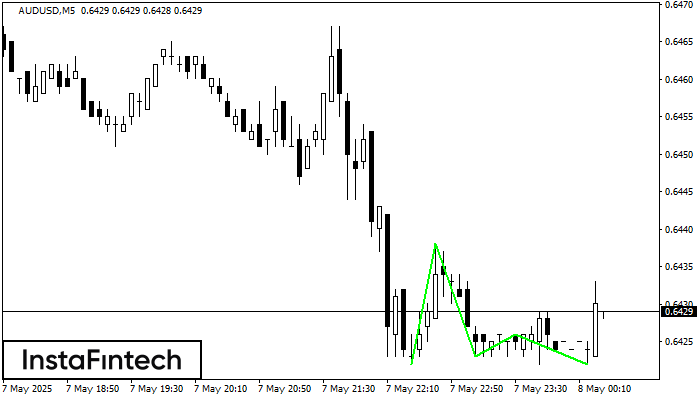
Pola Bawah Triple telah terbentuk pada grafik AUDUSD M5. Fitur-fitur pola: garis bawah pola memiliki koordinat 0.6438 dengan batas atas 0.6438/0.6426, proyeksi lebar adalah 16 poin. Pembentukan pola Bawah Triple
Rangka waktu M5 dan M15 mungkin memiliki lebih dari titik entri yang keliru.
Open chart in a new window


