

वास्तविक पैटर्न

पैटर्न ग्राफिकल मॉडल हैं जो चार्ट में मूल्य से बने होते हैं। तकनीकी विश्लेषण भविष्यवाणियों में से एक के अनुसार, इतिहास का मतलब मूल्य आंदोलन खुद को दोहराता है। इसका मतलब है कि मूल्य आंदोलन अक्सर एक ही परिस्थितियों में समान होते हैं जो उच्च संभावना के साथ स्थिति के आगे के विकास की भविष्यवाणी करना संभव बनाता है।
इंस्टा फॉरेक्स द्वारा प्रासंगिक पैटर्न एक उपयोग में आसान सेवा है जो आपको बाजार में नवीनतम परिवर्तनों के बारे में जागरूक होने और समय पर बाजार से संकेतों पर प्रतिक्रिया करने की अनुमति देती है। हमारी सेवा में आप हमेशा किसी भी जोड़ी और किसी भी समय सीमा पर नवीनतम और सबसे प्रासंगिक पैटर्न प्राप्त कर सकते हैं.
Double Top
was formed on 25.03 at 22:17:10 (UTC+0)
signal strength 2 of 5
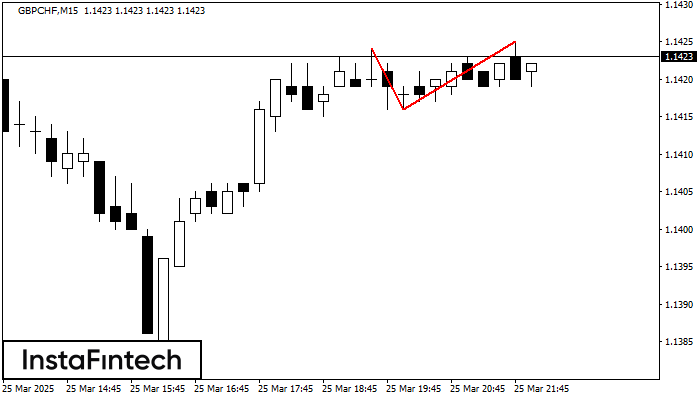
On the chart of GBPCHF M15 the Double Top reversal pattern has been formed. Characteristics: the upper boundary 1.1425; the lower boundary 1.1416; the width of the pattern 9 points. The signal: a break of the lower boundary will cause continuation of the downward trend targeting the 1.1394 level.
The M5 and M15 time frames may have more false entry points.
See Also
- All
- All
- Bearish Rectangle
- Bearish Symmetrical Triangle
- Bearish Symmetrical Triangle
- Bullish Rectangle
- Double Top
- Double Top
- Triple Bottom
- Triple Bottom
- Triple Top
- Triple Top
- All
- All
- Buy
- Sale
- All
- 1
- 2
- 3
- 4
- 5
Double Top
was formed on 11.04 at 18:30:14 (UTC+0)
signal strength 1 of 5
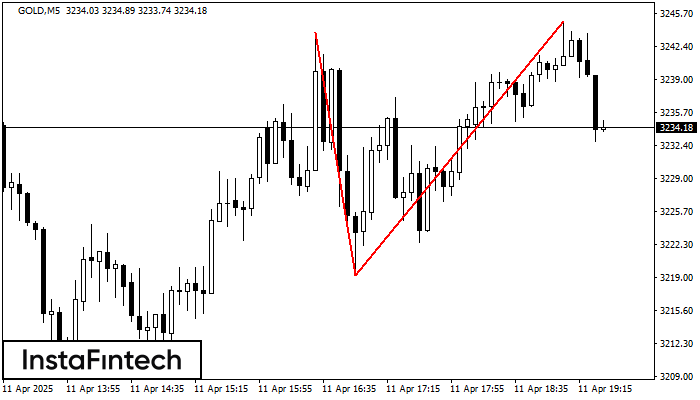
The Double Top reversal pattern has been formed on GOLD M5. Characteristics: the upper boundary 3243.80; the lower boundary 3219.16; the width of the pattern is 2574 points. Sell trades
The M5 and M15 time frames may have more false entry points.
Open chart in a new window
Double Top
was formed on 11.04 at 18:30:14 (UTC+0)
signal strength 2 of 5
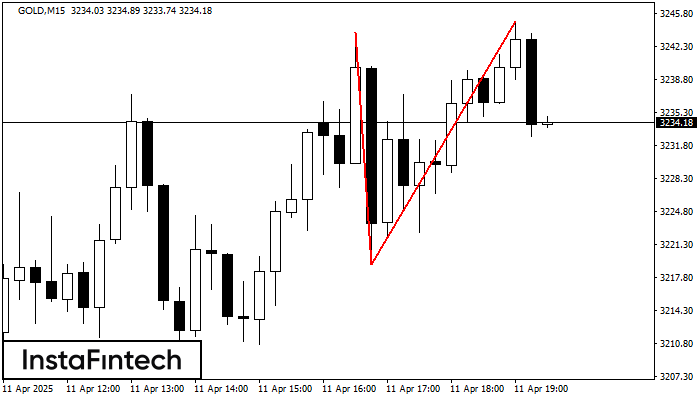
The Double Top reversal pattern has been formed on GOLD M15. Characteristics: the upper boundary 3243.80; the lower boundary 3219.16; the width of the pattern is 2574 points. Sell trades
The M5 and M15 time frames may have more false entry points.
Open chart in a new window
Bearish Rectangle
was formed on 11.04 at 18:25:14 (UTC+0)
signal strength 1 of 5
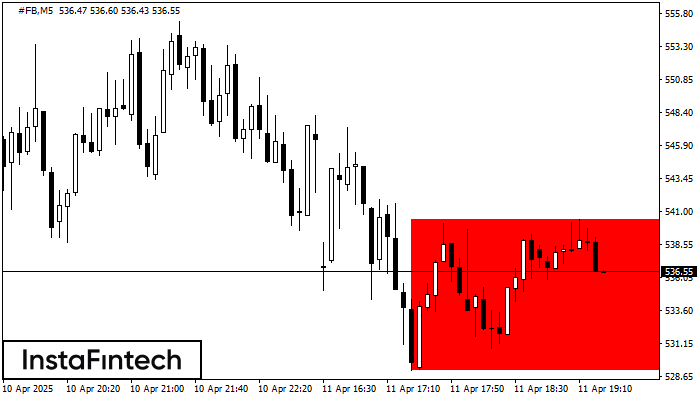
According to the chart of M5, #FB formed the Bearish Rectangle which is a pattern of a trend continuation. The pattern is contained within the following borders: lower border 529.17
The M5 and M15 time frames may have more false entry points.
Open chart in a new window


