

Pola sebenarnya

Double Top
was formed on 25.04 at 00:30:06 (UTC+0)
signal strength 2 of 5
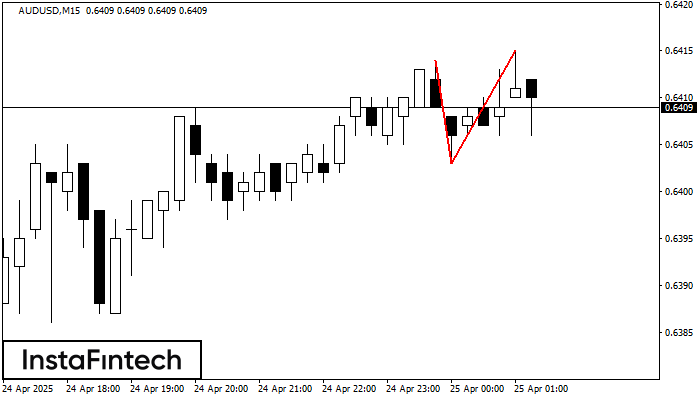
On the chart of AUDUSD M15 the Double Top reversal pattern has been formed. Characteristics: the upper boundary 0.6415; the lower boundary 0.6403; the width of the pattern 12 points. The signal: a break of the lower boundary will cause continuation of the downward trend targeting the 0.6381 level.
The M5 and M15 time frames may have more false entry points.
- All
- All
- Bearish Rectangle
- Bearish Symmetrical Triangle
- Bearish Symmetrical Triangle
- Bullish Rectangle
- Double Top
- Double Top
- Triple Bottom
- Triple Bottom
- Triple Top
- Triple Top
- All
- All
- Buy
- Sale
- All
- 1
- 2
- 3
- 4
- 5
Persegi Bearish
was formed on 09.05 at 02:22:04 (UTC+0)
signal strength 3 of 5
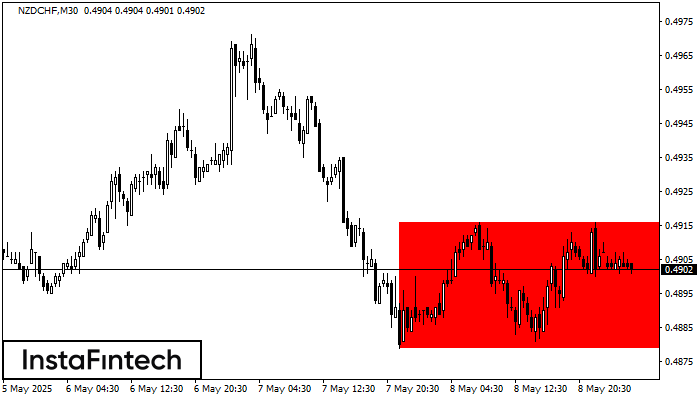
Menurut grafik dari M30, NZDCHF terbentuk Persegi Bearish. Pola menunjukkan kelanjutan tren. Batas atas adalah 0.4916, batas rendah adalah 0.4879. Sinyal berarti posisi jual harus dibuka setelah menetapkan harga dibawah
Open chart in a new window
Persegi Bearish
was formed on 09.05 at 02:21:54 (UTC+0)
signal strength 4 of 5
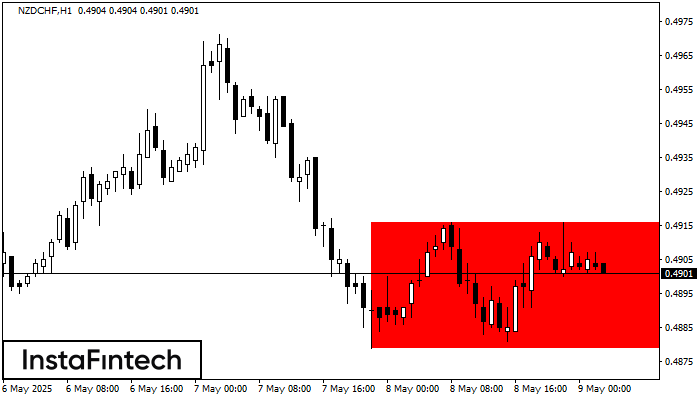
Menurut grafik dari H1, NZDCHF terbentuk Persegi Bearish. Pola menunjukkan kelanjutan tren. Batas atas adalah 0.4916, batas rendah adalah 0.4879. Sinyal berarti posisi jual harus dibuka setelah menetapkan harga dibawah
Open chart in a new window
Teratas Ganda
was formed on 09.05 at 02:15:13 (UTC+0)
signal strength 2 of 5
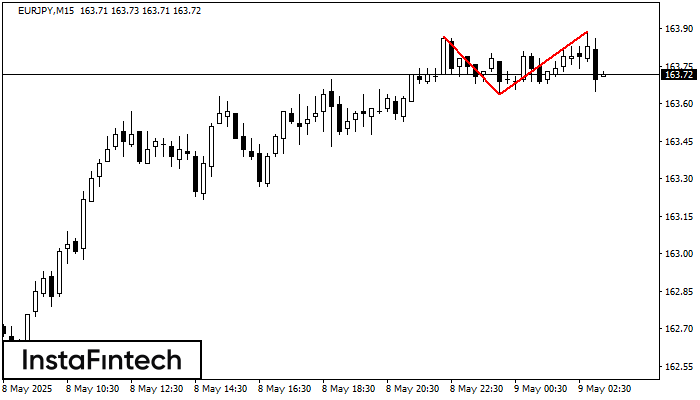
Pada grafik EURJPY M15 pola reversal Teratas Ganda telah terbentuk. Karakteristik: batas atas 163.89; batas bawah 163.64; lebar pola 25 poin. Sinyal: tembusan ke batas bawah akan menyebabkan kelanjutan tren
Rangka waktu M5 dan M15 mungkin memiliki lebih dari titik entri yang keliru.
Open chart in a new window

