

Pola sebenarnya

Bullish Symmetrical Triangle
was formed on 22.04 at 20:06:01 (UTC+0)
signal strength 1 of 5
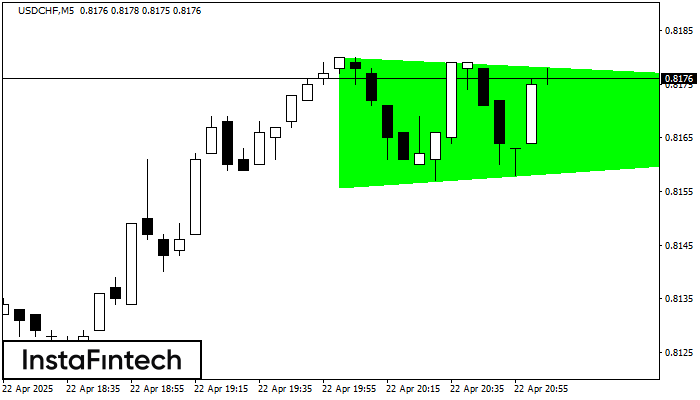
According to the chart of M5, USDCHF formed the Bullish Symmetrical Triangle pattern, which signals the trend will continue. Description. The upper border of the pattern touches the coordinates 0.8180/0.8170 whereas the lower border goes across 0.8156/0.8170. The pattern width is measured on the chart at 24 pips. If the Bullish Symmetrical Triangle pattern is in progress during the upward trend, this indicates the current trend will go on. In case 0.8170 is broken, the price could continue its move toward 0.8185.
The M5 and M15 time frames may have more false entry points.
Lihat juga
- All
- All
- Bearish Rectangle
- Bearish Symmetrical Triangle
- Bearish Symmetrical Triangle
- Bullish Rectangle
- Double Top
- Double Top
- Triple Bottom
- Triple Bottom
- Triple Top
- Triple Top
- All
- All
- Buy
- Sale
- All
- 1
- 2
- 3
- 4
- 5
Kepala dan bahu
was formed on 14.05 at 19:30:34 (UTC+0)
signal strength 1 of 5

Pola teknikal yang disebut Kepala dan bahu telah muncul pada grafik GBPCHF M5. Terdapat banyak alasan untuk harga melewati Neckline 1.1164/1.1166 setelah Shoulder kanan terbentuk. Jadi, tren akan berubah dengan
Rangka waktu M5 dan M15 mungkin memiliki lebih dari titik entri yang keliru.
Open chart in a new window
Teratas Ganda
was formed on 14.05 at 19:30:23 (UTC+0)
signal strength 4 of 5
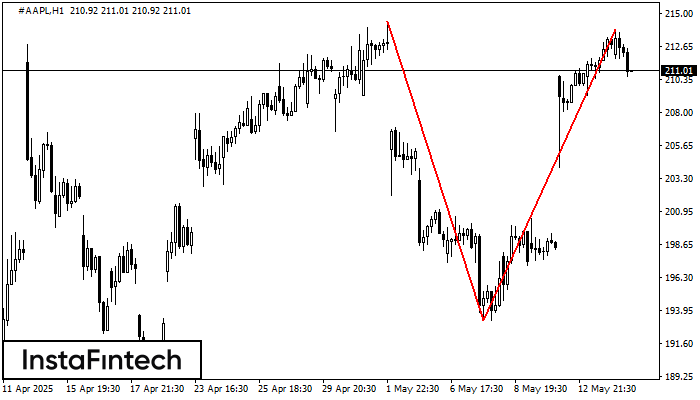
Pola Teratas Ganda telah terbentuk pada #AAPL H1. Pola ini menandakan bahwa tren telah berubah dari kenaikan menjadi penurunan. Mungkin, jika dasar pola di 193.24 ditembus, maka pergerakan menurun akan
Open chart in a new window
Bawah Ganda
was formed on 14.05 at 19:04:05 (UTC+0)
signal strength 1 of 5
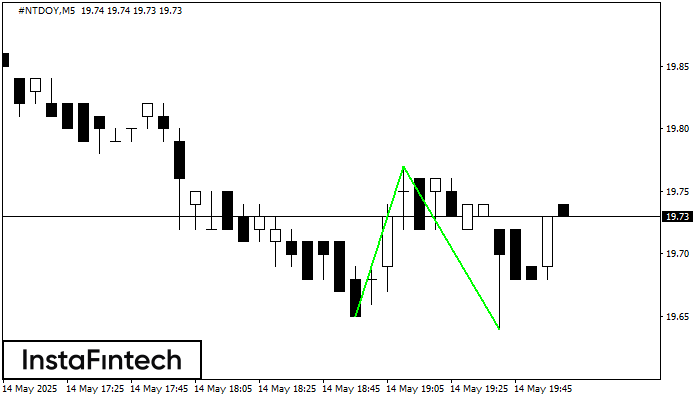
Pola Bawah Ganda telah terbentuk pada #NTDOY M5. Formasi ini mensinyalkan reversal tren dari arah penurunan ke arah kenaikan. Sinyal menunjukkan bahwa transaksi beli harus dibuka setelah batas atas pola
Rangka waktu M5 dan M15 mungkin memiliki lebih dari titik entri yang keliru.
Open chart in a new window


