

Pola sebenarnya

Double Top
was formed on 22.04 at 04:35:45 (UTC+0)
signal strength 1 of 5

The Double Top reversal pattern has been formed on NZDCHF M5. Characteristics: the upper boundary 0.4869; the lower boundary 0.4861; the width of the pattern is 7 points. Sell trades are better to be opened below the lower boundary 0.4861 with a possible movements towards the 0.4846 level.
The M5 and M15 time frames may have more false entry points.
Lihat juga
- All
- All
- Bearish Rectangle
- Bearish Symmetrical Triangle
- Bearish Symmetrical Triangle
- Bullish Rectangle
- Double Top
- Double Top
- Triple Bottom
- Triple Bottom
- Triple Top
- Triple Top
- All
- All
- Buy
- Sale
- All
- 1
- 2
- 3
- 4
- 5
Kepala dan Bahu Terbalik
was formed on 09.05 at 16:00:01 (UTC+0)
signal strength 3 of 5
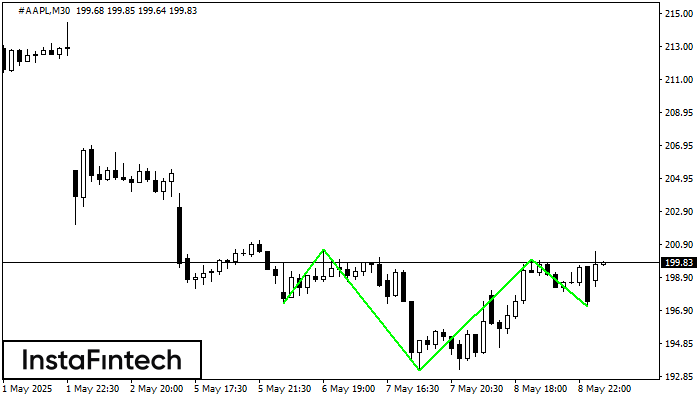
Menurut M30, #AAPL membentuk pola teknikal – Kepala dan Bahu Terbalik. Jika garis leher (Neckline) 200.60/200.00 ditembus, maka instrumen ini kemungkinan akan bergerak menuju 200.30
Open chart in a new window
Persegi Bullish
was formed on 09.05 at 15:45:48 (UTC+0)
signal strength 4 of 5
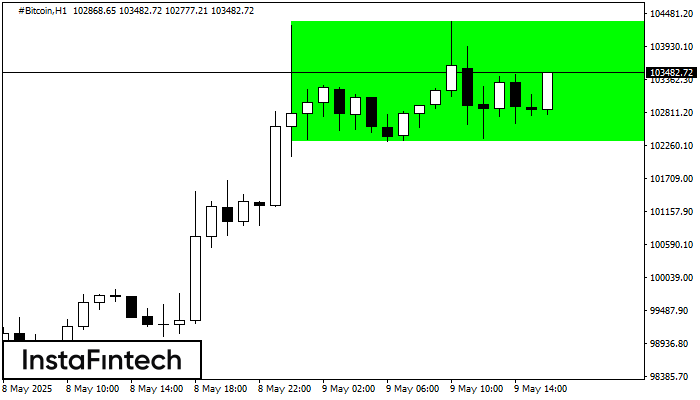
Menurut grafik dari H1, #Bitcoin terbentuk Persegi Bullish yang merupakan pola dari kelanjutan tren. Pola terkandung dalam batas berikut: batas yang lebih rendah 102332.80 – 102332.80 dan batas atas 104346.22
Open chart in a new window
Persegi Bullish
was formed on 09.05 at 15:02:04 (UTC+0)
signal strength 2 of 5
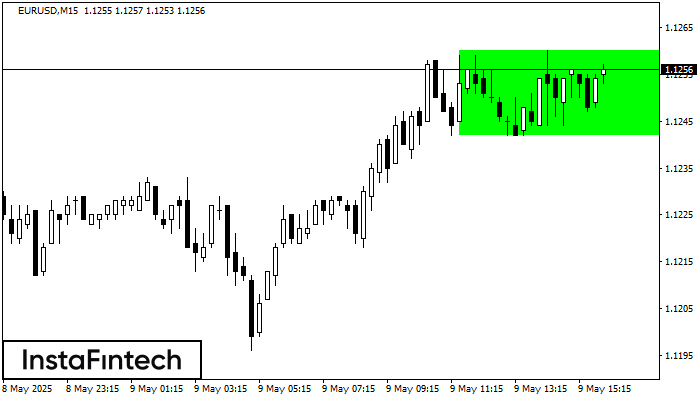
Menurut grafik dari M15, EURUSD terbentuk Persegi Bullish. Pola menunjukkan kelanjutan tren. Batas atas adalah 1.1260, batas lebih rendah adalah 1.1242. Sinyal berarti posisi beli harus dibuka diatas batas atas
Rangka waktu M5 dan M15 mungkin memiliki lebih dari titik entri yang keliru.
Open chart in a new window


