

Pola sebenarnya

Bearish Symmetrical Triangle
was formed on 21.04 at 23:42:32 (UTC+0)
signal strength 3 of 5

According to the chart of M30, NZDJPY formed the Bearish Symmetrical Triangle pattern. Description: The lower border is 83.98/84.43 and upper border is 84.90/84.43. The pattern width is measured on the chart at -92 pips. The formation of the Bearish Symmetrical Triangle pattern evidently signals a continuation of the downward trend. In other words, if the scenario comes true and NZDJPY breaches the lower border, the price could continue its move toward 84.13.
- All
- All
- Bearish Rectangle
- Bearish Symmetrical Triangle
- Bearish Symmetrical Triangle
- Bullish Rectangle
- Double Top
- Double Top
- Triple Bottom
- Triple Bottom
- Triple Top
- Triple Top
- All
- All
- Buy
- Sale
- All
- 1
- 2
- 3
- 4
- 5
Bawah Triple
was formed on 05.05 at 21:40:10 (UTC+0)
signal strength 1 of 5
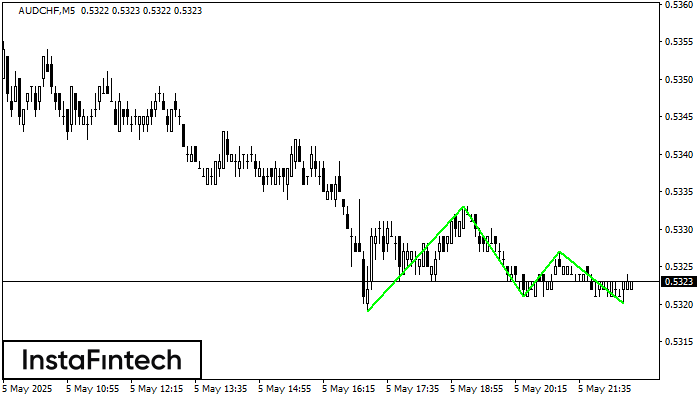
Pola Bawah Triple telah terbentuk pada grafik AUDCHF M5. Fitur-fitur pola: garis bawah pola memiliki koordinat 0.5333 dengan batas atas 0.5333/0.5327, proyeksi lebar adalah 14 poin. Pembentukan pola Bawah Triple
Rangka waktu M5 dan M15 mungkin memiliki lebih dari titik entri yang keliru.
Open chart in a new window
Teratas Ganda
was formed on 05.05 at 21:30:11 (UTC+0)
signal strength 1 of 5
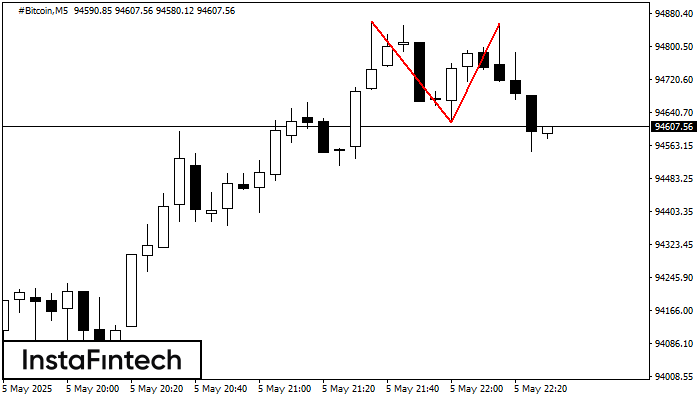
Pola reversal Teratas Ganda telah terbentuk pada #Bitcoin M5. Karakteristik: batas atas 94860.22; batas bawah 94618.10; lebar pola 23764 poin. Transaksi jual lebih baik dibuka di bawah batas bawah 94618.10
Rangka waktu M5 dan M15 mungkin memiliki lebih dari titik entri yang keliru.
Open chart in a new window
Bawah Ganda
was formed on 05.05 at 21:15:11 (UTC+0)
signal strength 2 of 5
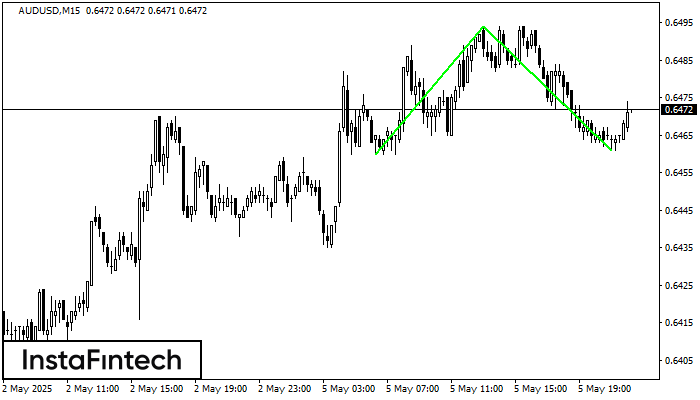
Pola Bawah Ganda telah terbentuk pada AUDUSD M15; batas atas di 0.6494; batas bawah di 0.6461. Lebar pola sebesar 34 poin. Jika harga menembus batas atas 0.6494, Perubahan dalam tren
Rangka waktu M5 dan M15 mungkin memiliki lebih dari titik entri yang keliru.
Open chart in a new window

