

Pola sebenarnya

Bearish pennant
was formed on 21.04 at 17:59:57 (UTC+0)
signal strength 3 of 5
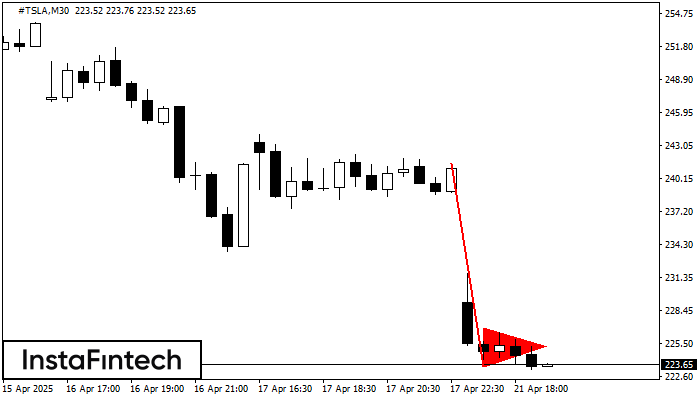
The Bearish pennant pattern has formed on the #TSLA M30 chart. It signals potential continuation of the existing trend. Specifications: the pattern’s bottom has the coordinate of 223.47; the projection of the flagpole height is equal to 1803 pips. In case the price breaks out the pattern’s bottom of 223.47, the downtrend is expected to continue for further level 223.17.
- All
- All
- Bearish Rectangle
- Bearish Symmetrical Triangle
- Bearish Symmetrical Triangle
- Bullish Rectangle
- Double Top
- Double Top
- Triple Bottom
- Triple Bottom
- Triple Top
- Triple Top
- All
- All
- Buy
- Sale
- All
- 1
- 2
- 3
- 4
- 5
Bawah Ganda
was formed on 06.05 at 03:45:33 (UTC+0)
signal strength 1 of 5
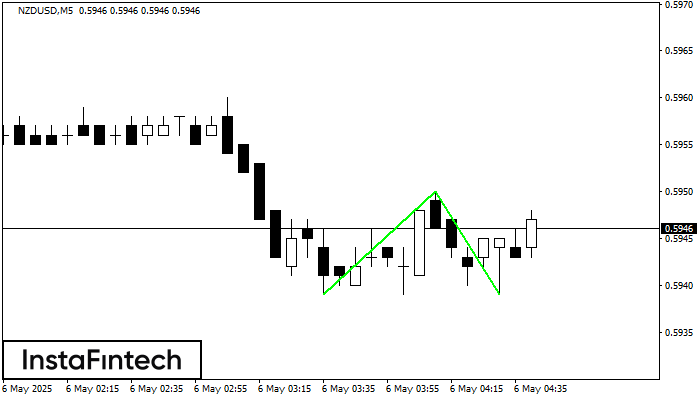
Pola Bawah Ganda telah terbentuk pada NZDUSD M5; batas atas di 0.5950; batas bawah di 0.5939. Lebar pola sebesar 11 poin. Jika harga menembus batas atas 0.5950, Perubahan dalam tren
Rangka waktu M5 dan M15 mungkin memiliki lebih dari titik entri yang keliru.
Open chart in a new window
Bawah Triple
was formed on 06.05 at 03:00:35 (UTC+0)
signal strength 4 of 5

Pola Bawah Triple telah terbentuk pada GBPCHF H1. Pola tersebut memiliki karakteristik sebagai berikut: level resistance 1.0997/1.0988; level support 1.0919/1.0919; dengan lebar 78 poin. Jika terjadi pemecahan (breakdown) pada level
Open chart in a new window
Bawah Triple
was formed on 06.05 at 03:00:33 (UTC+0)
signal strength 4 of 5
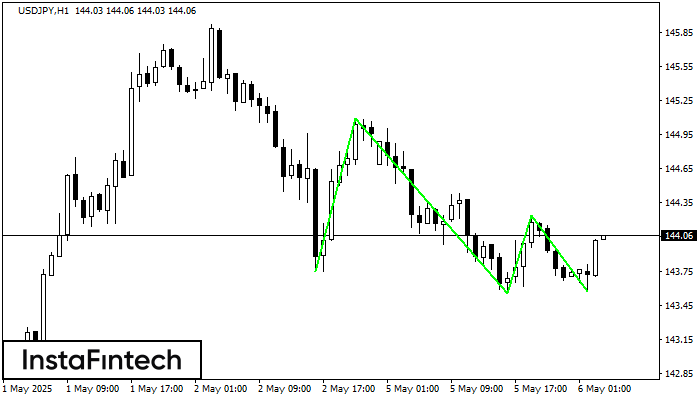
Pola Bawah Triple telah terbentuk pada grafik USDJPY H1. Fitur-fitur pola: garis bawah pola memiliki koordinat 145.09 dengan batas atas 145.09/144.24, proyeksi lebar adalah 134 poin. Pembentukan pola Bawah Triple
Open chart in a new window


