

Pola sebenarnya

Double Bottom
was formed on 21.04 at 15:29:52 (UTC+0)
signal strength 3 of 5

The Double Bottom pattern has been formed on GBPCHF M30. This formation signals a reversal of the trend from downwards to upwards. The signal is that a buy trade should be opened after the upper boundary of the pattern 1.0810 is broken. The further movements will rely on the width of the current pattern 27 points.
- All
- All
- Bearish Rectangle
- Bearish Symmetrical Triangle
- Bearish Symmetrical Triangle
- Bullish Rectangle
- Double Top
- Double Top
- Triple Bottom
- Triple Bottom
- Triple Top
- Triple Top
- All
- All
- Buy
- Sale
- All
- 1
- 2
- 3
- 4
- 5
Bullish Symmetrical Triangle
was formed on 06.05 at 01:24:48 (UTC+0)
signal strength 1 of 5
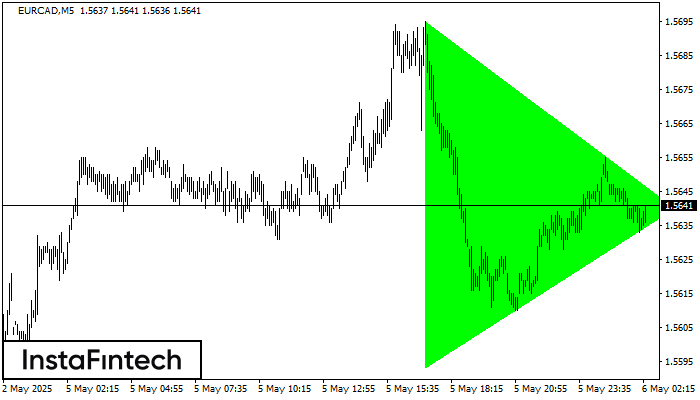
According to the chart of M5, EURCAD formed the Bullish Symmetrical Triangle pattern. The lower border of the pattern touches the coordinates 1.5593/1.5640 whereas the upper border goes across 1.5695/1.5640
The M5 and M15 time frames may have more false entry points.
Open chart in a new window
Bullish Rectangle
was formed on 06.05 at 00:40:34 (UTC+0)
signal strength 1 of 5
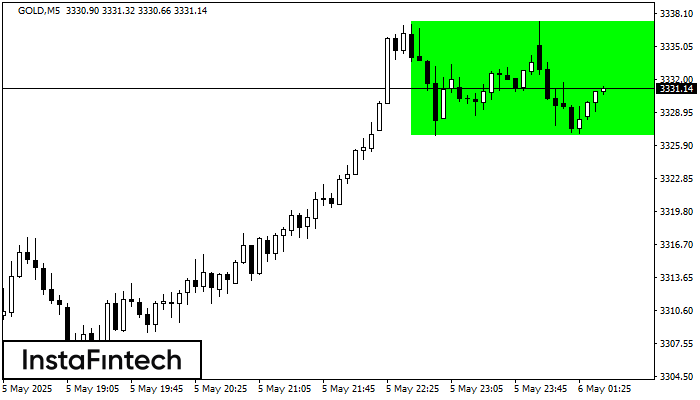
According to the chart of M5, GOLD formed the Bullish Rectangle. This type of a pattern indicates a trend continuation. It consists of two levels: resistance 3337.37 and support 3326.83
The M5 and M15 time frames may have more false entry points.
Open chart in a new window
Triple Bottom
was formed on 06.05 at 00:20:44 (UTC+0)
signal strength 1 of 5

The Triple Bottom pattern has formed on the chart of USDJPY M5. Features of the pattern: The lower line of the pattern has coordinates 143.80 with the upper limit 143.80/143.76
The M5 and M15 time frames may have more false entry points.
Open chart in a new window


