

Pola sebenarnya

Head and Shoulders
was formed on 18.04 at 18:05:18 (UTC+0)
signal strength 1 of 5

The EURJPY M5 formed the Head and Shoulders pattern with the following features: The Head’s top is at 162.14, the Neckline and the upward angle are at 161.98/161.96. The formation of this pattern can bring about changes in the current trend from bullish to bearish. In case the pattern triggers the expected changes, the price of EURJPY will go towards 161.81.
The M5 and M15 time frames may have more false entry points.
- All
- All
- Bearish Rectangle
- Bearish Symmetrical Triangle
- Bearish Symmetrical Triangle
- Bullish Rectangle
- Double Top
- Double Top
- Triple Bottom
- Triple Bottom
- Triple Top
- Triple Top
- All
- All
- Buy
- Sale
- All
- 1
- 2
- 3
- 4
- 5
Inverse Head and Shoulder
was formed on 08.05 at 11:55:15 (UTC+0)
signal strength 1 of 5
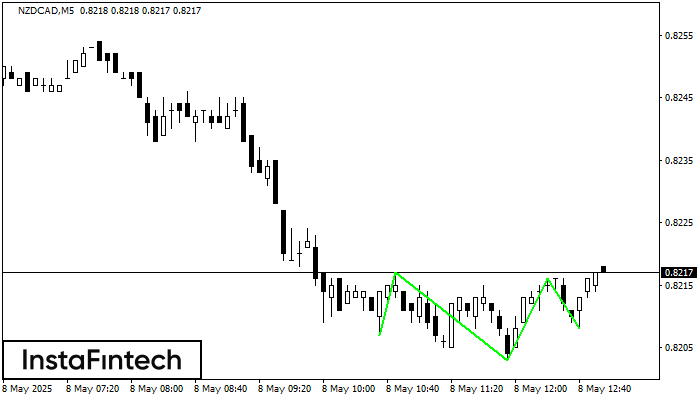
According to M5, NZDCAD is shaping the technical pattern – the Inverse Head and Shoulder. In case the Neckline 0.8217/0.8216 is broken out, the instrument is likely to move toward
The M5 and M15 time frames may have more false entry points.
Open chart in a new window
Triple Bottom
was formed on 08.05 at 11:11:41 (UTC+0)
signal strength 1 of 5
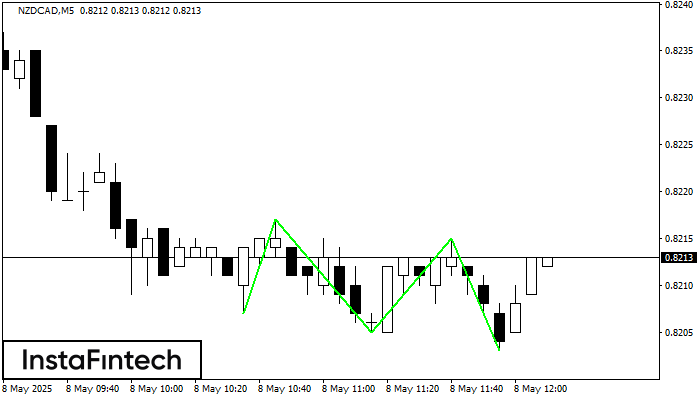
The Triple Bottom pattern has formed on the chart of NZDCAD M5. Features of the pattern: The lower line of the pattern has coordinates 0.8217 with the upper limit 0.8217/0.8215
The M5 and M15 time frames may have more false entry points.
Open chart in a new window
Bearish Symmetrical Triangle
was formed on 08.05 at 11:01:57 (UTC+0)
signal strength 2 of 5
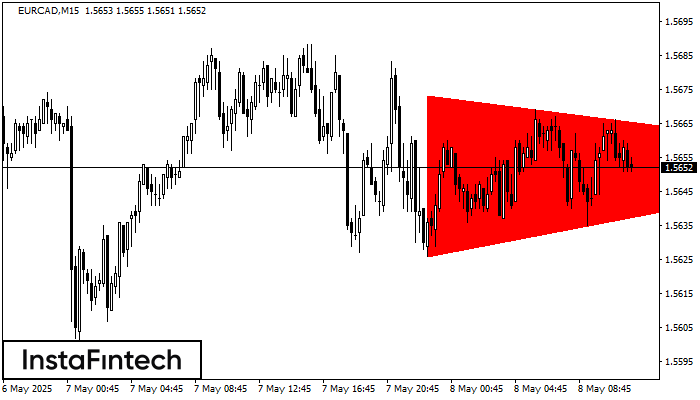
According to the chart of M15, EURCAD formed the Bearish Symmetrical Triangle pattern. This pattern signals a further downward trend in case the lower border 1.5626 is breached. Here
The M5 and M15 time frames may have more false entry points.
Open chart in a new window


