

Pola sebenarnya

Bullish Rectangle
was formed on 18.04 at 01:04:53 (UTC+0)
signal strength 1 of 5

According to the chart of M5, EURJPY formed the Bullish Rectangle which is a pattern of a trend continuation. The pattern is contained within the following borders: the lower border 161.76 – 161.76 and upper border 161.97 – 161.97. In case the upper border is broken, the instrument is likely to follow the upward trend.
The M5 and M15 time frames may have more false entry points.
Lihat juga
- All
- All
- Bearish Rectangle
- Bearish Symmetrical Triangle
- Bearish Symmetrical Triangle
- Bullish Rectangle
- Double Top
- Double Top
- Triple Bottom
- Triple Bottom
- Triple Top
- Triple Top
- All
- All
- Buy
- Sale
- All
- 1
- 2
- 3
- 4
- 5
Double Top
was formed on 09.05 at 11:00:06 (UTC+0)
signal strength 3 of 5
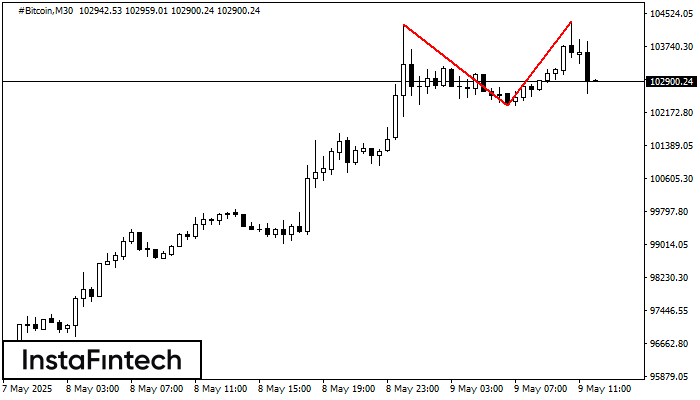
The Double Top pattern has been formed on #Bitcoin M30. It signals that the trend has been changed from upwards to downwards. Probably, if the base of the pattern 102332.80
Open chart in a new window
Double Top
was formed on 09.05 at 10:44:55 (UTC+0)
signal strength 2 of 5
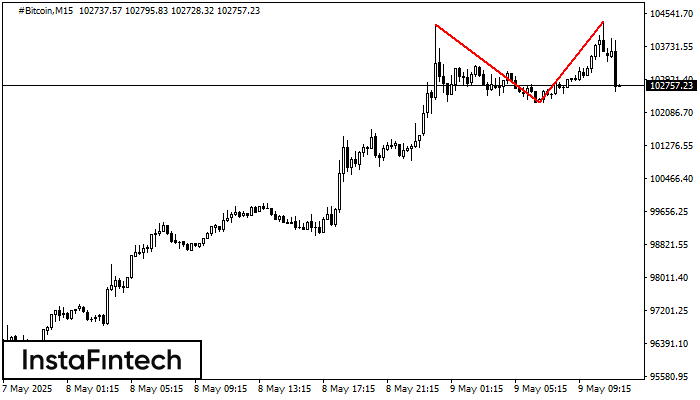
The Double Top reversal pattern has been formed on #Bitcoin M15. Characteristics: the upper boundary 104269.79; the lower boundary 102332.80; the width of the pattern is 201342 points. Sell trades
The M5 and M15 time frames may have more false entry points.
Open chart in a new window
Inverse Head and Shoulder
was formed on 09.05 at 10:00:01 (UTC+0)
signal strength 3 of 5
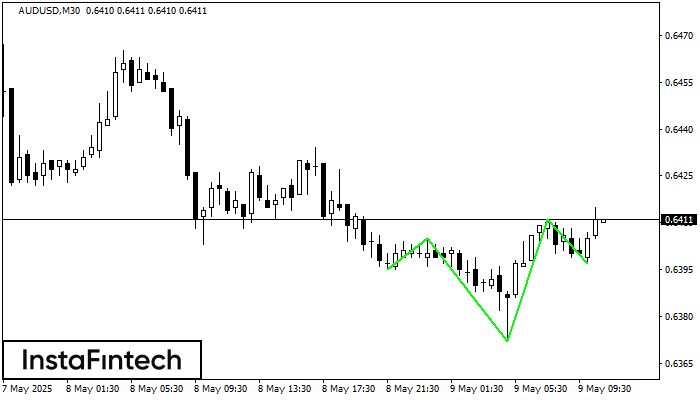
According to M30, AUDUSD is shaping the technical pattern – the Inverse Head and Shoulder. In case the Neckline 0.6405/0.6411 is broken out, the instrument is likely to move toward
Open chart in a new window


