

Pola sebenarnya

Bearish Symmetrical Triangle
was formed on 16.04 at 02:00:48 (UTC+0)
signal strength 1 of 5

According to the chart of M5, NZDJPY formed the Bearish Symmetrical Triangle pattern. Description: The lower border is 84.16/84.34 and upper border is 84.51/84.34. The pattern width is measured on the chart at -35 pips. The formation of the Bearish Symmetrical Triangle pattern evidently signals a continuation of the downward trend. In other words, if the scenario comes true and NZDJPY breaches the lower border, the price could continue its move toward 84.19.
The M5 and M15 time frames may have more false entry points.
Lihat juga
- All
- All
- Bearish Rectangle
- Bearish Symmetrical Triangle
- Bearish Symmetrical Triangle
- Bullish Rectangle
- Double Top
- Double Top
- Triple Bottom
- Triple Bottom
- Triple Top
- Triple Top
- All
- All
- Buy
- Sale
- All
- 1
- 2
- 3
- 4
- 5
Triple Top
was formed on 13.05 at 18:45:11 (UTC+0)
signal strength 1 of 5
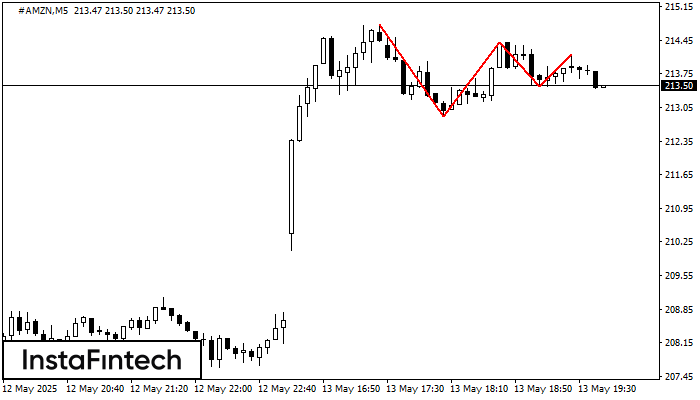
The Triple Top pattern has formed on the chart of the #AMZN M5 trading instrument. It is a reversal pattern featuring the following characteristics: resistance level 63, support level -61
The M5 and M15 time frames may have more false entry points.
Open chart in a new window
Bullish Flag
was formed on 13.05 at 18:36:15 (UTC+0)
signal strength 3 of 5
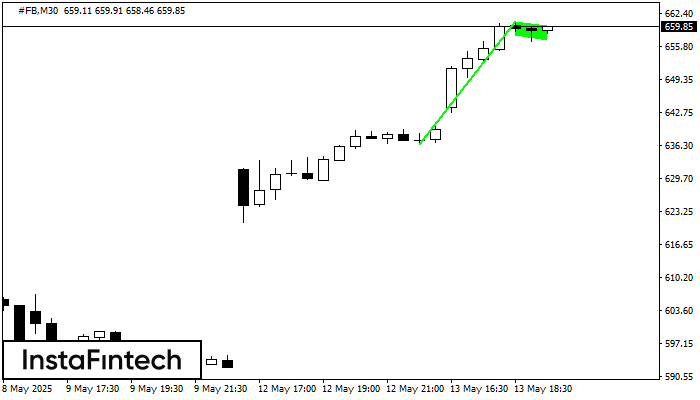
The Bullish Flag pattern which signals continuation of a trend has been formed on the chart #FB M30. Forecast: if the price breaks above the pattern high at 660.84, then
Open chart in a new window
Triple Bottom
was formed on 13.05 at 18:35:14 (UTC+0)
signal strength 1 of 5
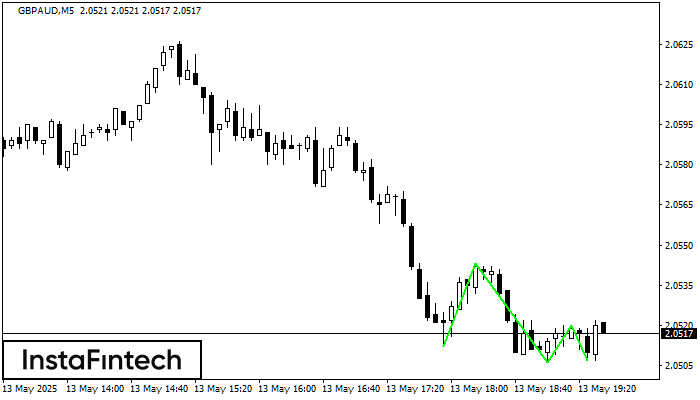
The Triple Bottom pattern has formed on the chart of the GBPAUD M5 trading instrument. The pattern signals a change in the trend from downwards to upwards in the case
The M5 and M15 time frames may have more false entry points.
Open chart in a new window


