

Pola sebenarnya

Double Top
was formed on 16.04 at 00:00:27 (UTC+0)
signal strength 3 of 5
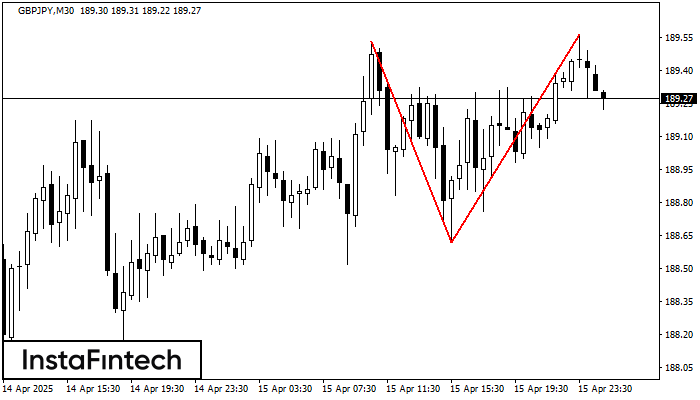
The Double Top reversal pattern has been formed on GBPJPY M30. Characteristics: the upper boundary 189.53; the lower boundary 188.62; the width of the pattern is 94 points. Sell trades are better to be opened below the lower boundary 188.62 with a possible movements towards the 188.32 level.
- All
- All
- Bearish Rectangle
- Bearish Symmetrical Triangle
- Bearish Symmetrical Triangle
- Bullish Rectangle
- Double Top
- Double Top
- Triple Bottom
- Triple Bottom
- Triple Top
- Triple Top
- All
- All
- Buy
- Sale
- All
- 1
- 2
- 3
- 4
- 5
Bullish Symmetrical Triangle
was formed on 09.05 at 21:50:28 (UTC+0)
signal strength 1 of 5
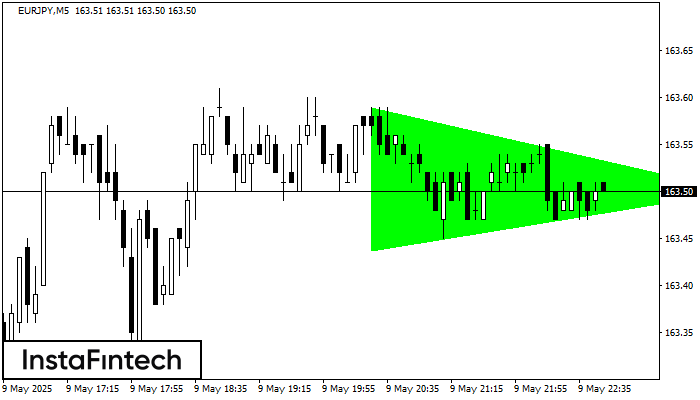
According to the chart of M5, EURJPY formed the Bullish Symmetrical Triangle pattern, which signals the trend will continue. Description. The upper border of the pattern touches the coordinates 163.59/163.50
The M5 and M15 time frames may have more false entry points.
Open chart in a new window
Double Bottom
was formed on 09.05 at 21:45:26 (UTC+0)
signal strength 2 of 5
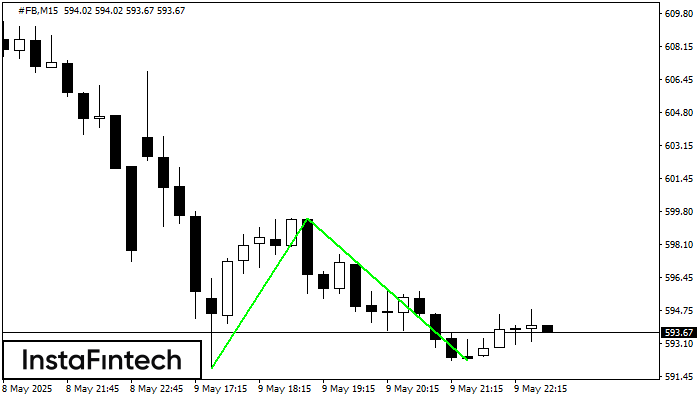
The Double Bottom pattern has been formed on #FB M15; the upper boundary is 599.43; the lower boundary is 592.24. The width of the pattern is 760 points. In case
The M5 and M15 time frames may have more false entry points.
Open chart in a new window
Bullish Symmetrical Triangle
was formed on 09.05 at 21:23:22 (UTC+0)
signal strength 1 of 5
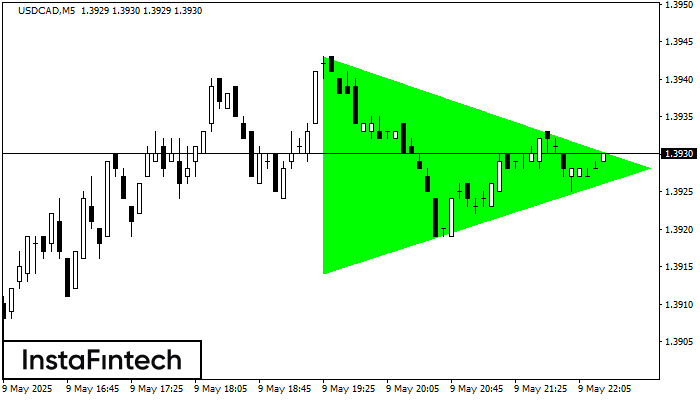
According to the chart of M5, USDCAD formed the Bullish Symmetrical Triangle pattern. Description: This is the pattern of a trend continuation. 1.3943 and 1.3914 are the coordinates
The M5 and M15 time frames may have more false entry points.
Open chart in a new window


