

Pola sebenarnya

Bullish Rectangle
was formed on 15.04 at 22:01:27 (UTC+0)
signal strength 3 of 5

According to the chart of M30, NZDCHF formed the Bullish Rectangle. This type of a pattern indicates a trend continuation. It consists of two levels: resistance 0.4859 and support 0.4839. In case the resistance level 0.4859 - 0.4859 is broken, the instrument is likely to follow the bullish trend.
- All
- All
- Bearish Rectangle
- Bearish Symmetrical Triangle
- Bearish Symmetrical Triangle
- Bullish Rectangle
- Double Top
- Double Top
- Triple Bottom
- Triple Bottom
- Triple Top
- Triple Top
- All
- All
- Buy
- Sale
- All
- 1
- 2
- 3
- 4
- 5
Double Bottom
was formed on 12.05 at 23:15:09 (UTC+0)
signal strength 1 of 5
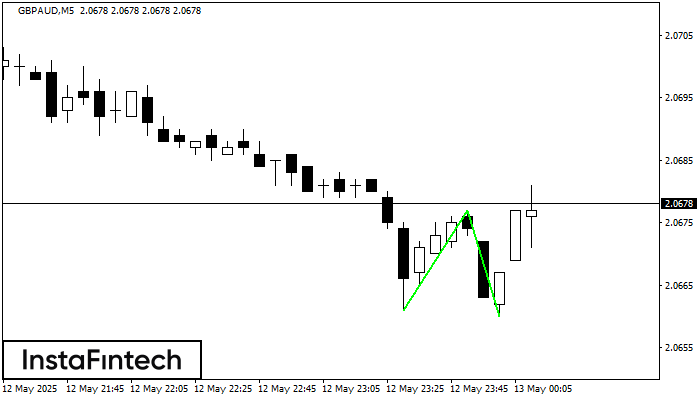
The Double Bottom pattern has been formed on GBPAUD M5; the upper boundary is 2.0677; the lower boundary is 2.0660. The width of the pattern is 16 points. In case
The M5 and M15 time frames may have more false entry points.
Open chart in a new window
Double Top
was formed on 12.05 at 22:00:17 (UTC+0)
signal strength 3 of 5
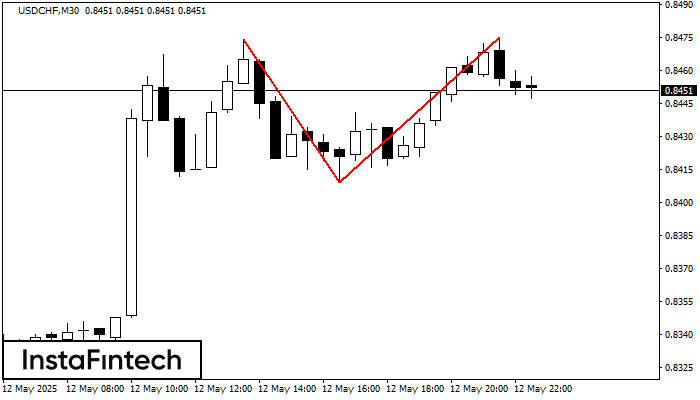
On the chart of USDCHF M30 the Double Top reversal pattern has been formed. Characteristics: the upper boundary 0.8475; the lower boundary 0.8409; the width of the pattern 66 points
Open chart in a new window
Triple Bottom
was formed on 12.05 at 21:55:25 (UTC+0)
signal strength 1 of 5
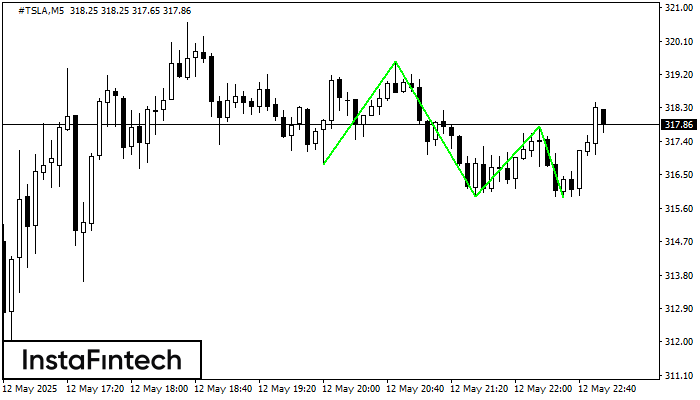
The Triple Bottom pattern has been formed on #TSLA M5. It has the following characteristics: resistance level 319.55/317.80; support level 316.79/315.89; the width is 276 points. In the event
The M5 and M15 time frames may have more false entry points.
Open chart in a new window

