

Pola sebenarnya

Triple Bottom
was formed on 15.04 at 01:15:13 (UTC+0)
signal strength 1 of 5

The Triple Bottom pattern has been formed on #Bitcoin M5. It has the following characteristics: resistance level 84720.65/84653.62; support level 84401.53/84425.81; the width is 31912 points. In the event of a breakdown of the resistance level of 84720.65, the price is likely to continue an upward movement at least to 84378.00.
The M5 and M15 time frames may have more false entry points.
- All
- All
- Bearish Rectangle
- Bearish Symmetrical Triangle
- Bearish Symmetrical Triangle
- Bullish Rectangle
- Double Top
- Double Top
- Triple Bottom
- Triple Bottom
- Triple Top
- Triple Top
- All
- All
- Buy
- Sale
- All
- 1
- 2
- 3
- 4
- 5
Kepala dan bahu
was formed on 12.05 at 08:15:31 (UTC+0)
signal strength 2 of 5
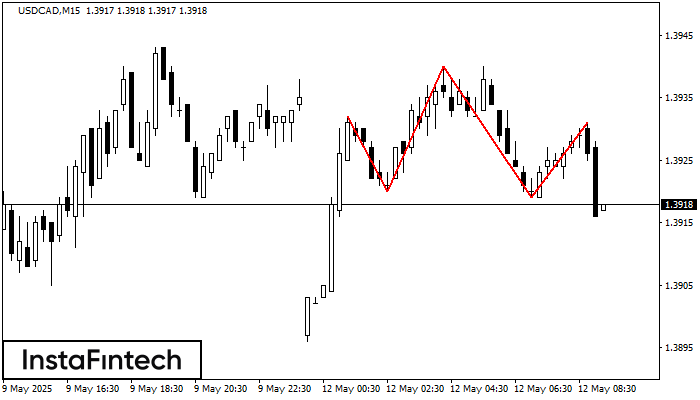
Menurut grafik M15, USDCAD membentuk pola Kepala dan bahu. Puncak The Head ditetapkan di 1.3940 sementara garis median the Neck ditemukan di 1.3920/1.3919. Formasi pola Kepala dan bahu terbukti mensinyalkan
Rangka waktu M5 dan M15 mungkin memiliki lebih dari titik entri yang keliru.
Open chart in a new window
Bawah Triple
was formed on 12.05 at 07:50:32 (UTC+0)
signal strength 1 of 5
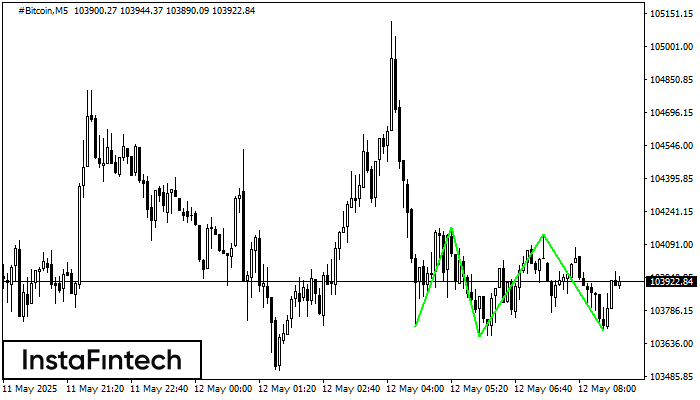
Pola Bawah Triple telah terbentuk pada #Bitcoin M5. Pola tersebut memiliki karakteristik sebagai berikut: level resistance 104168.40/104135.14; level support 103711.95/103696.30; dengan lebar 45645 poin. Jika terjadi pemecahan (breakdown) pada level
Rangka waktu M5 dan M15 mungkin memiliki lebih dari titik entri yang keliru.
Open chart in a new window
Segitiga Simetris Bullish
was formed on 12.05 at 07:45:41 (UTC+0)
signal strength 1 of 5
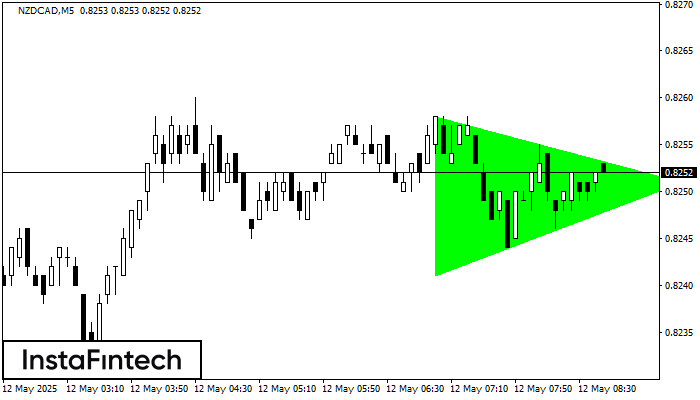
Menurut Grafik dari M5, NZDCAD dibentuk pola Segitiga Simetris Bullish. Deskripsi: Ini merupakan pola dari kelanjutan tren. 0.8258 dan 0.8241 adalah kordinat masing-masing dari batas atas dan lebih rendah. Lebar
Rangka waktu M5 dan M15 mungkin memiliki lebih dari titik entri yang keliru.
Open chart in a new window

