

Pola sebenarnya

Triple Top
was formed on 14.04 at 22:30:39 (UTC+0)
signal strength 3 of 5
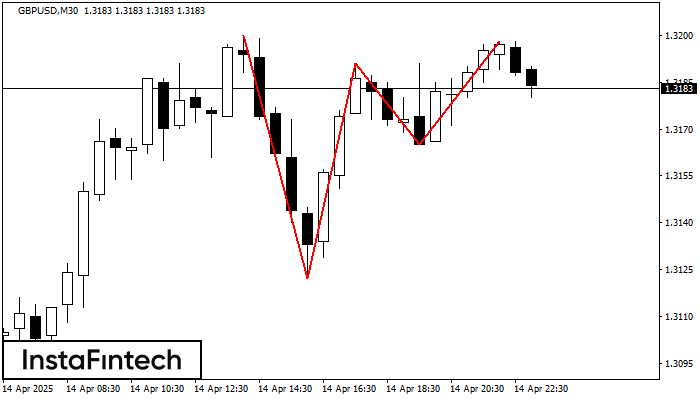
The Triple Top pattern has formed on the chart of the GBPUSD M30 trading instrument. It is a reversal pattern featuring the following characteristics: resistance level 2, support level -43, and pattern’s width 78. Forecast If the price breaks through the support level 1.3122, it is likely to move further down to 1.3161.
- All
- All
- Bearish Rectangle
- Bearish Symmetrical Triangle
- Bearish Symmetrical Triangle
- Bullish Rectangle
- Double Top
- Double Top
- Triple Bottom
- Triple Bottom
- Triple Top
- Triple Top
- All
- All
- Buy
- Sale
- All
- 1
- 2
- 3
- 4
- 5
Head and Shoulders
was formed on 09.05 at 05:05:03 (UTC+0)
signal strength 1 of 5
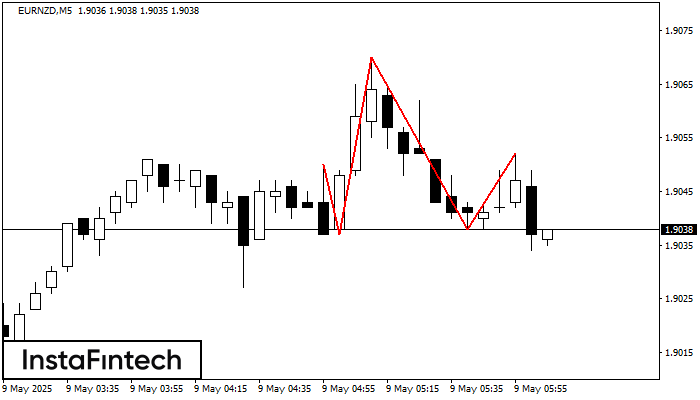
The EURNZD M5 formed the Head and Shoulders pattern with the following features: The Head’s top is at 1.9070, the Neckline and the upward angle are at 1.9037/1.9038. The formation
The M5 and M15 time frames may have more false entry points.
Open chart in a new window
Bearish Rectangle
was formed on 09.05 at 04:05:35 (UTC+0)
signal strength 2 of 5
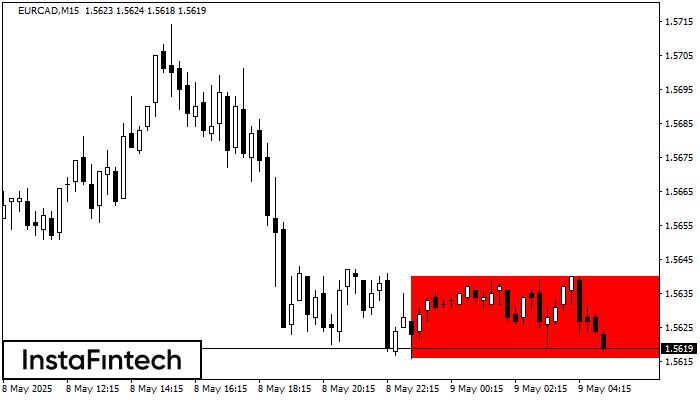
According to the chart of M15, EURCAD formed the Bearish Rectangle. The pattern indicates a trend continuation. The upper border is 1.5640, the lower border is 1.5616. The signal means
The M5 and M15 time frames may have more false entry points.
Open chart in a new window
Bearish Rectangle
was formed on 09.05 at 04:05:14 (UTC+0)
signal strength 3 of 5
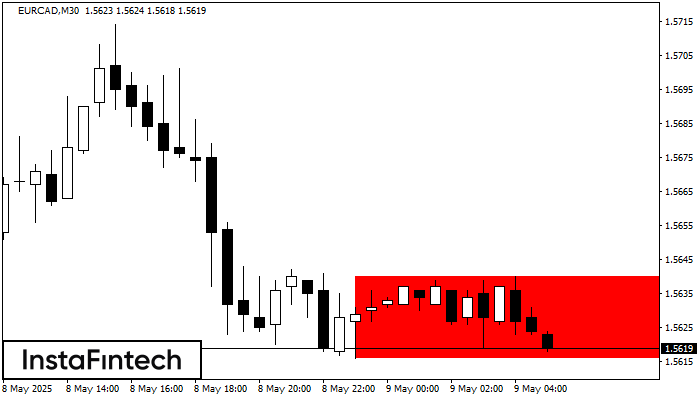
According to the chart of M30, EURCAD formed the Bearish Rectangle which is a pattern of a trend continuation. The pattern is contained within the following borders: lower border 1.5616
Open chart in a new window


